Fig. 15
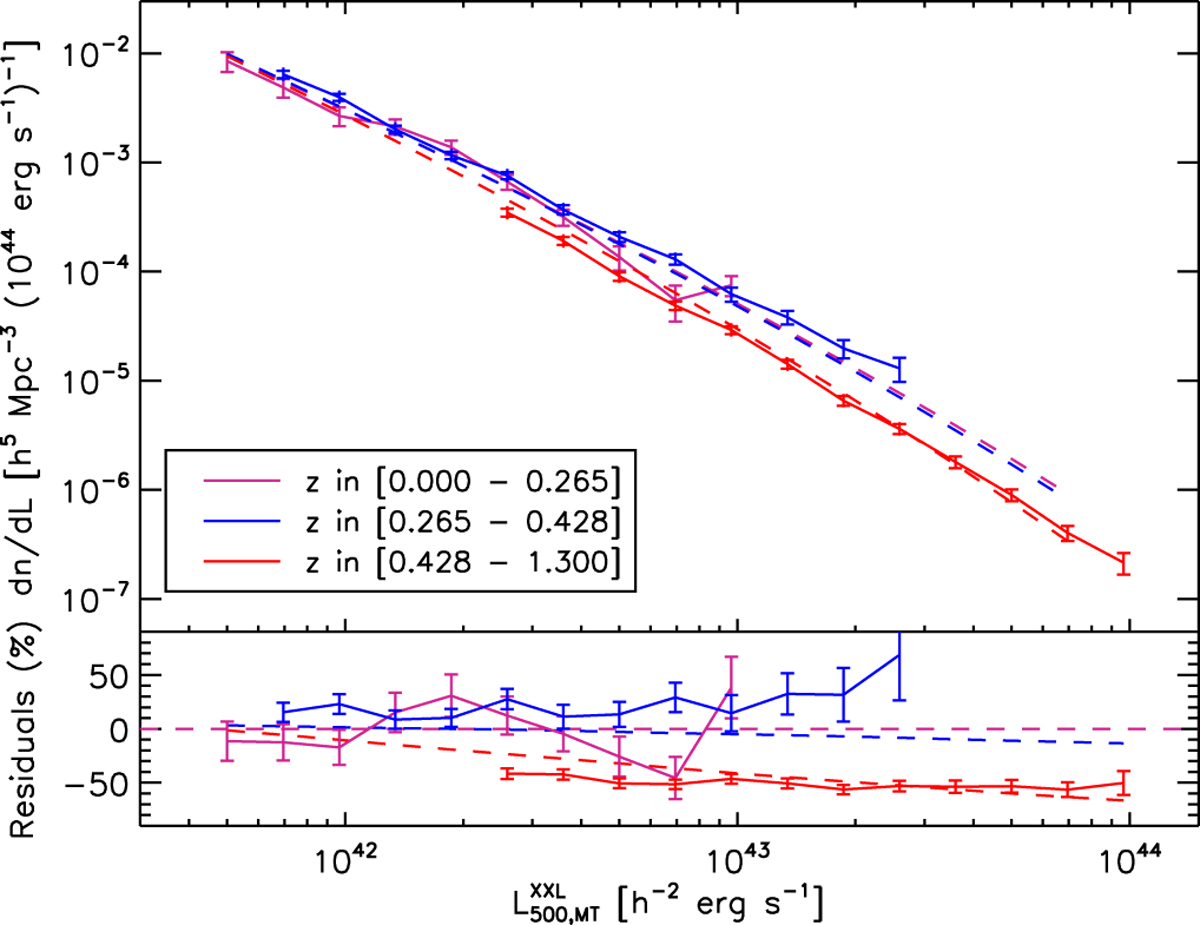
Redshift evolution of the C1 X-ray luminosity function. The calculation relies on the same assumptions as for the full survey volume luminosity function of Fig. 14, but the sample is split into three redshift bins containing approximately the same number counts of clusters. The dashed lines show, for the same redshift bins, the luminosity function expected in the WMAP9 cosmology from our scaling relation model (M500,WL − T300 kpc
from XXL Paper IV and ![]() ). For better visualisation, the bottom panel shows the same information in the form of a residual plot with respect to the WMAP9 expectation at low redshift. A significant negative evolution is visible at
z ≥ 0.43.
). For better visualisation, the bottom panel shows the same information in the form of a residual plot with respect to the WMAP9 expectation at low redshift. A significant negative evolution is visible at
z ≥ 0.43.
Current usage metrics show cumulative count of Article Views (full-text article views including HTML views, PDF and ePub downloads, according to the available data) and Abstracts Views on Vision4Press platform.
Data correspond to usage on the plateform after 2015. The current usage metrics is available 48-96 hours after online publication and is updated daily on week days.
Initial download of the metrics may take a while.