Fig. 14
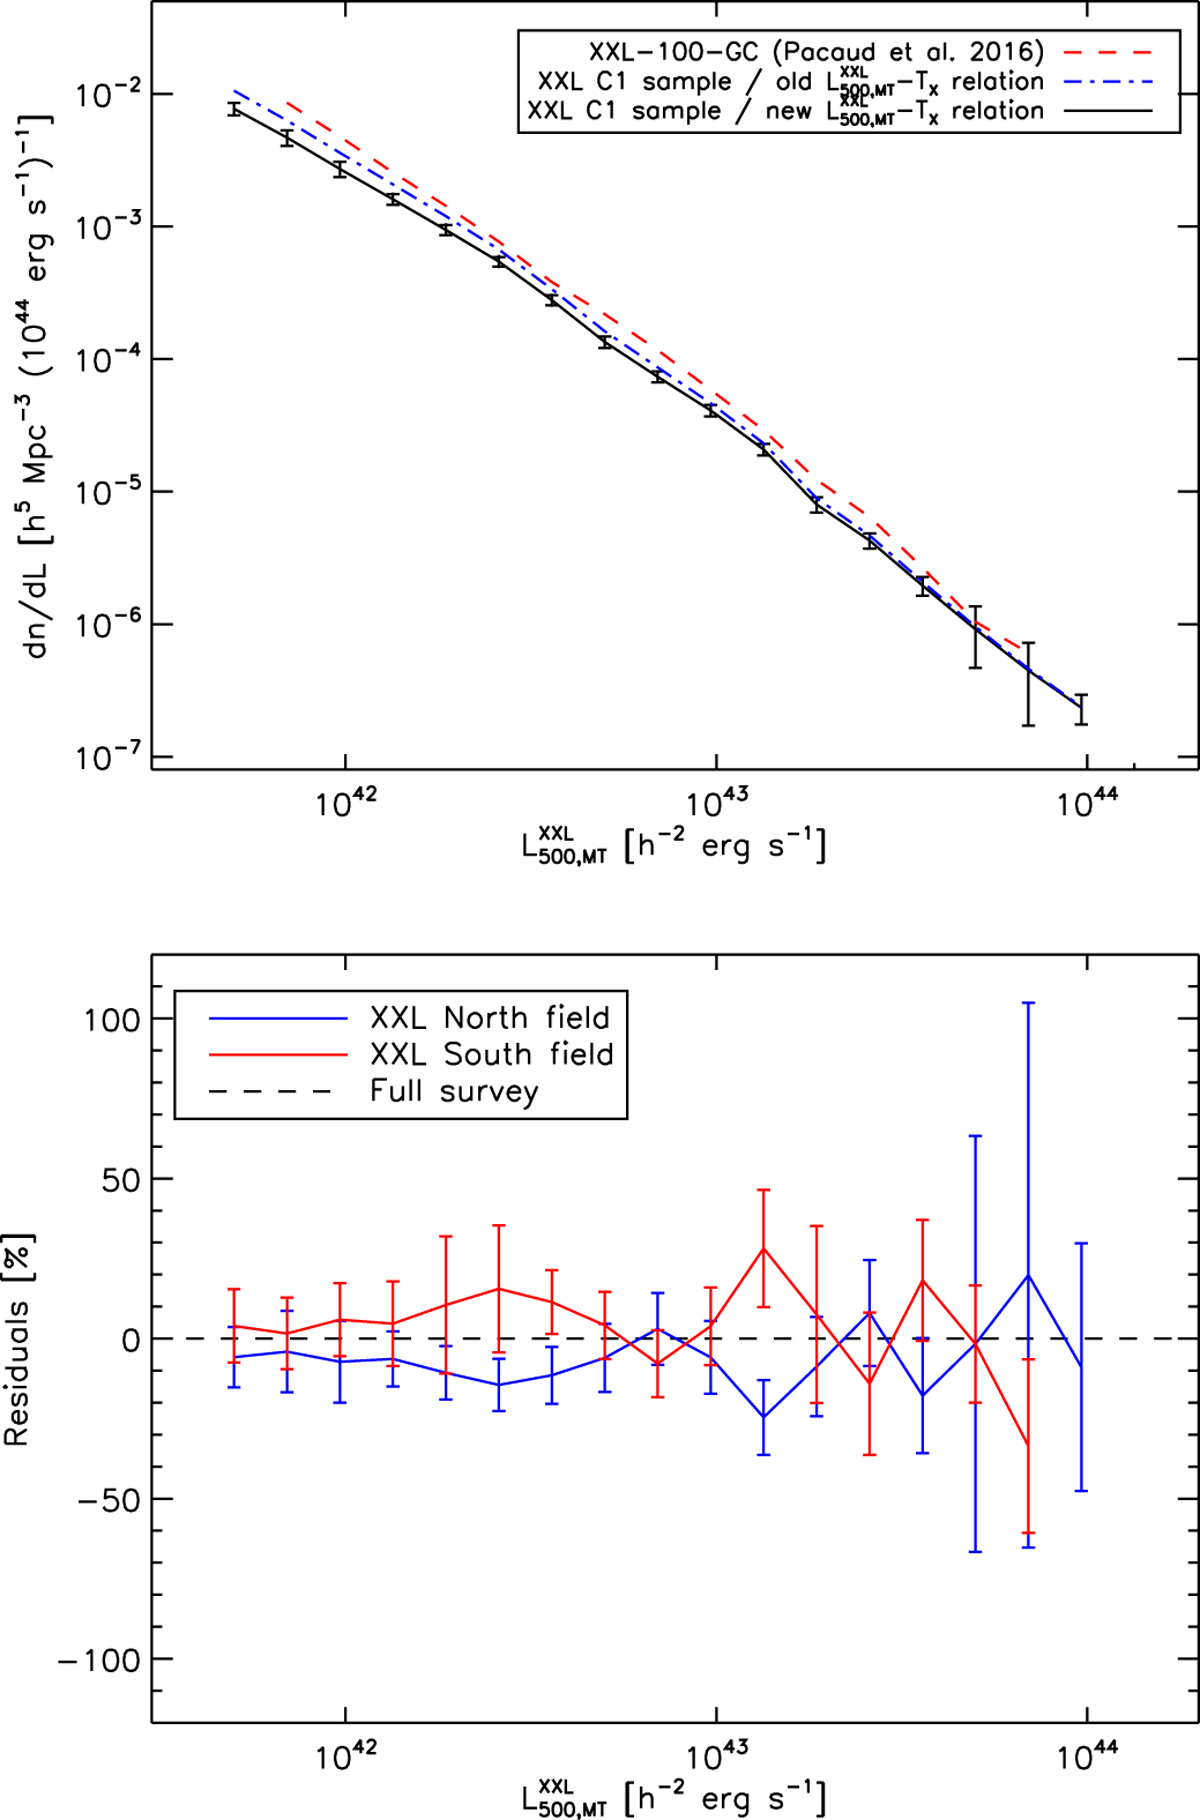
Upper panel: X-ray luminosity function ([0.5–2] keV band) of the C1 cluster sample based on the 186 C1 clusters in good pointings and with redshift information. The calculation is averaged over the whole survey volume (z in 0.0–1.3) and includes an incompleteness factor of 2.6% for the five C1 clusters without any redshift estimate. The method is the same as in XXL Paper II. For comparison, the luminosity function of the XXL brightest 100 cluster sample (XXL-100-GC) is shown with the red dashed line. Finally, the dot-dashedblue line indicates the luminosity function of the C1 sample recomputed for with the old LX − T relation of XXL Paper III, as was assumed for the XXL-100-GC sample. Lower panel: residuals of the C1 luminosity functions computed from only the northern or southern XXL field with respect to the complete luminosity function shown in the upper panel.
Current usage metrics show cumulative count of Article Views (full-text article views including HTML views, PDF and ePub downloads, according to the available data) and Abstracts Views on Vision4Press platform.
Data correspond to usage on the plateform after 2015. The current usage metrics is available 48-96 hours after online publication and is updated daily on week days.
Initial download of the metrics may take a while.