Fig. 12
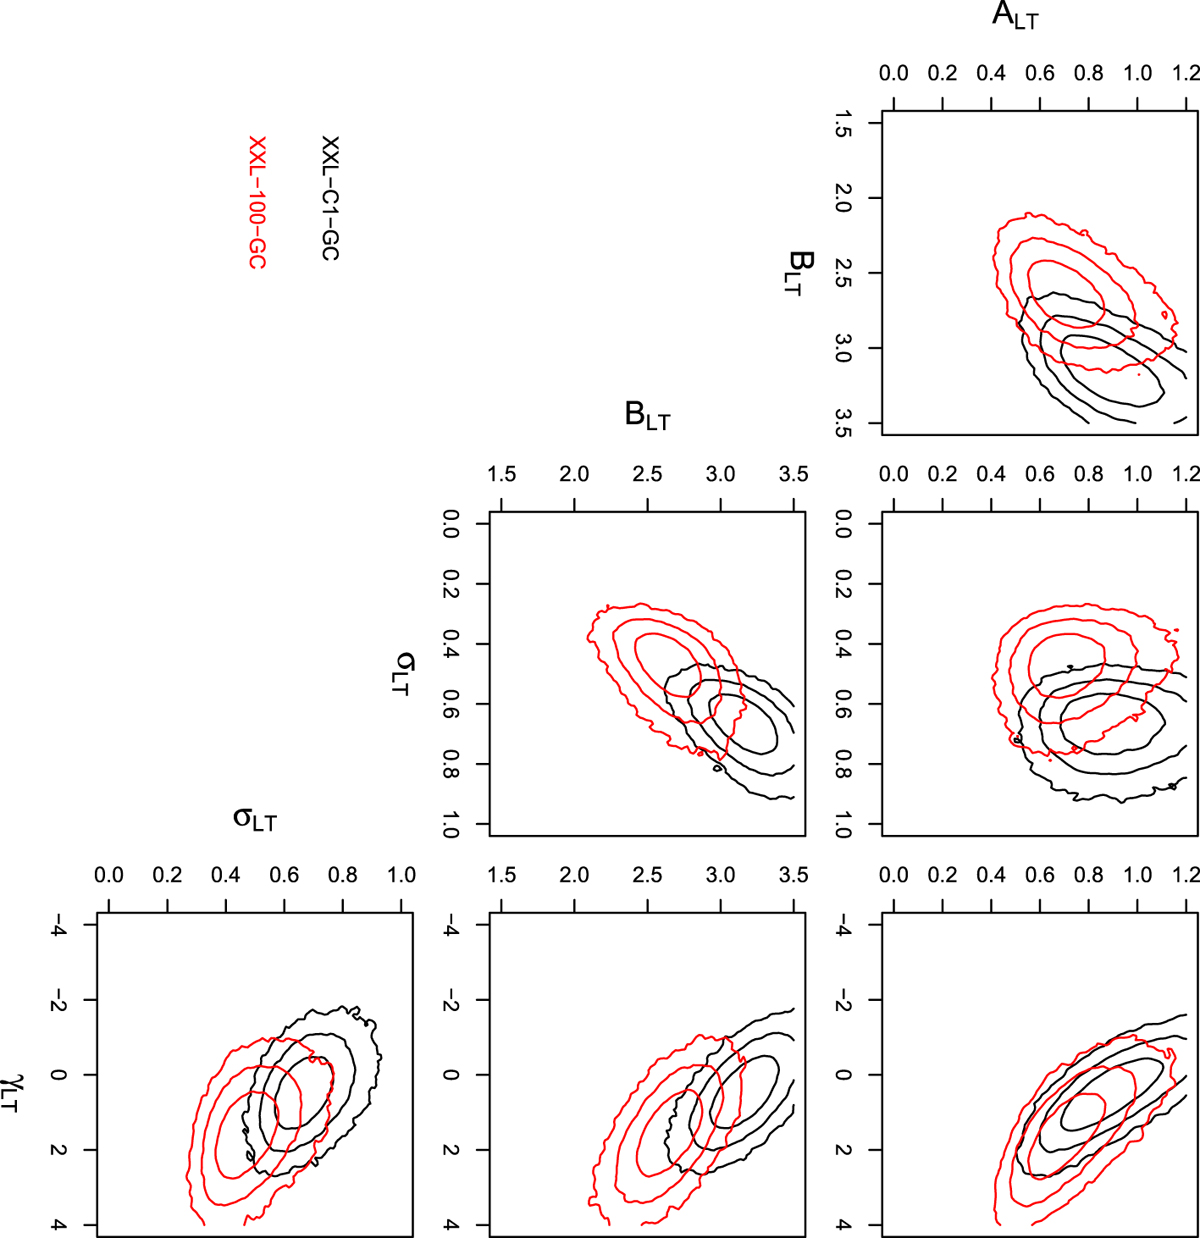
Matrix plot comparing the 1σ, 2σ and 3σ contours for pairs of parameters of the luminosity–temperature relation, with the XXL-C1-GC and XXL-100-GC contours given by the black and red contours respectively.
Current usage metrics show cumulative count of Article Views (full-text article views including HTML views, PDF and ePub downloads, according to the available data) and Abstracts Views on Vision4Press platform.
Data correspond to usage on the plateform after 2015. The current usage metrics is available 48-96 hours after online publication and is updated daily on week days.
Initial download of the metrics may take a while.