Fig. 10
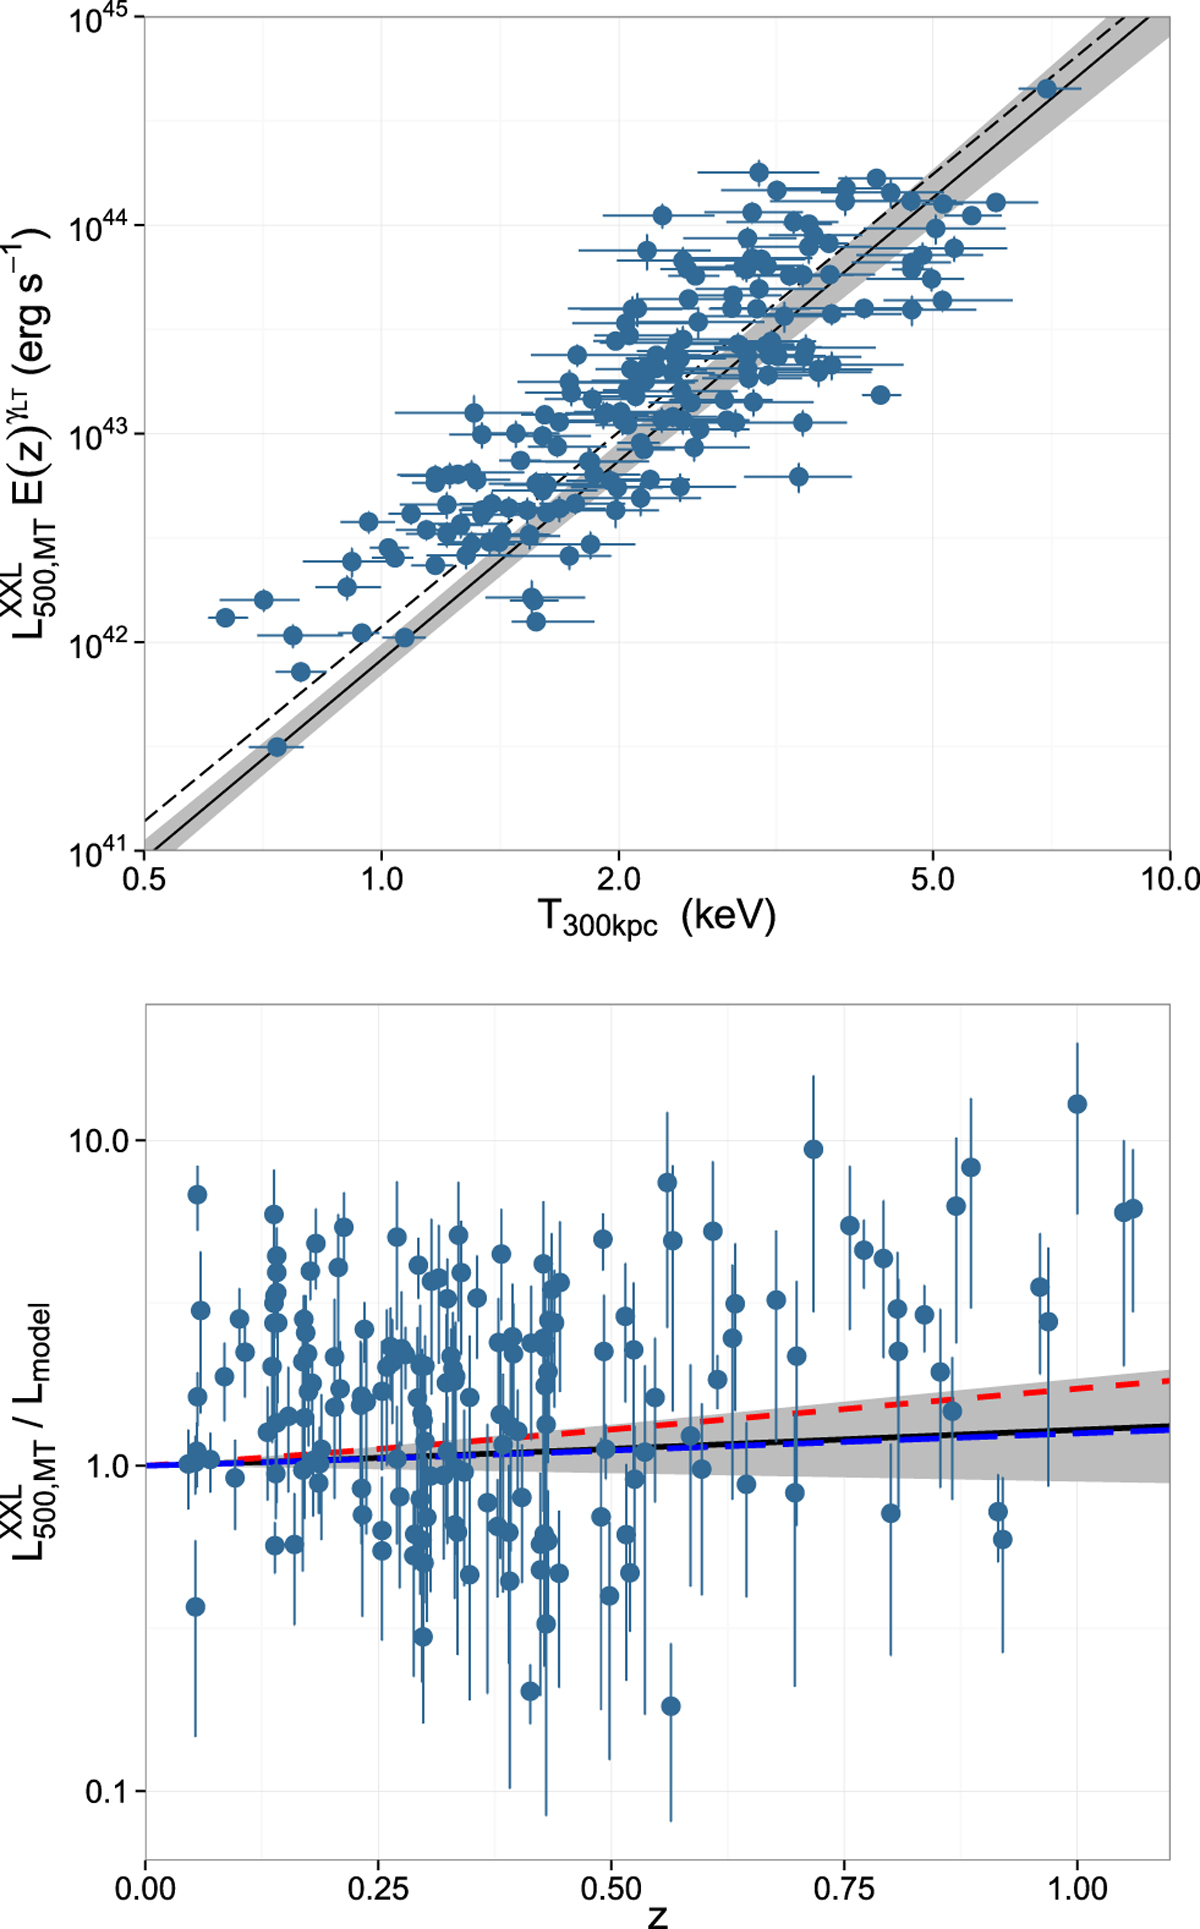
Upper panel: luminosity–temperature relation with the best-fitting models. The light blue circles show the XXL-C1-GC clusters; the best-fitting model (including selection effects) is shown by the solid black line, the 1σ uncertainty represented by the grey shaded region. The best-fitting model fitted to the data using the BCES regression is shown as the dashed line. Bottom panel: evolution of the luminosity–temperature relation for XXL-C1-GC. The XXL-C1-GC clusters are represented by the light blue circles and the best-fitting model is given by the black solid line; the grey shaded region highlights the 1σ uncertainty.The “strong” and “weak” self-similar expectations are given by the red dashed and blue dashed lines, respectively.
Current usage metrics show cumulative count of Article Views (full-text article views including HTML views, PDF and ePub downloads, according to the available data) and Abstracts Views on Vision4Press platform.
Data correspond to usage on the plateform after 2015. The current usage metrics is available 48-96 hours after online publication and is updated daily on week days.
Initial download of the metrics may take a while.