Free Access
Fig. 7
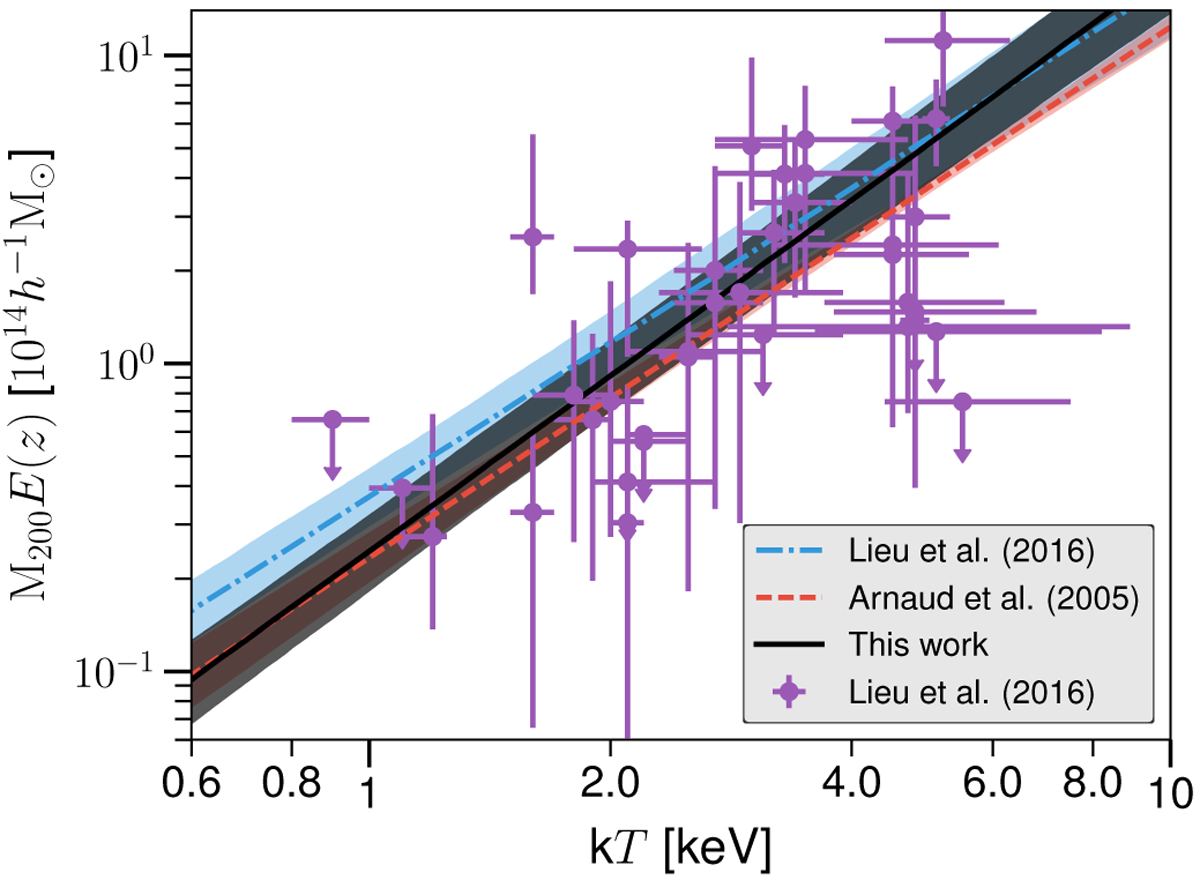
M200 − kT scaling relation from this work (black line and dark shaded region) is compared with published relations given in the legend and Table 4. Shaded regions are the 1σ uncertainty in the expected mass at a given temperature. See the text for more discussion.
Current usage metrics show cumulative count of Article Views (full-text article views including HTML views, PDF and ePub downloads, according to the available data) and Abstracts Views on Vision4Press platform.
Data correspond to usage on the plateform after 2015. The current usage metrics is available 48-96 hours after online publication and is updated daily on week days.
Initial download of the metrics may take a while.