Fig. 6
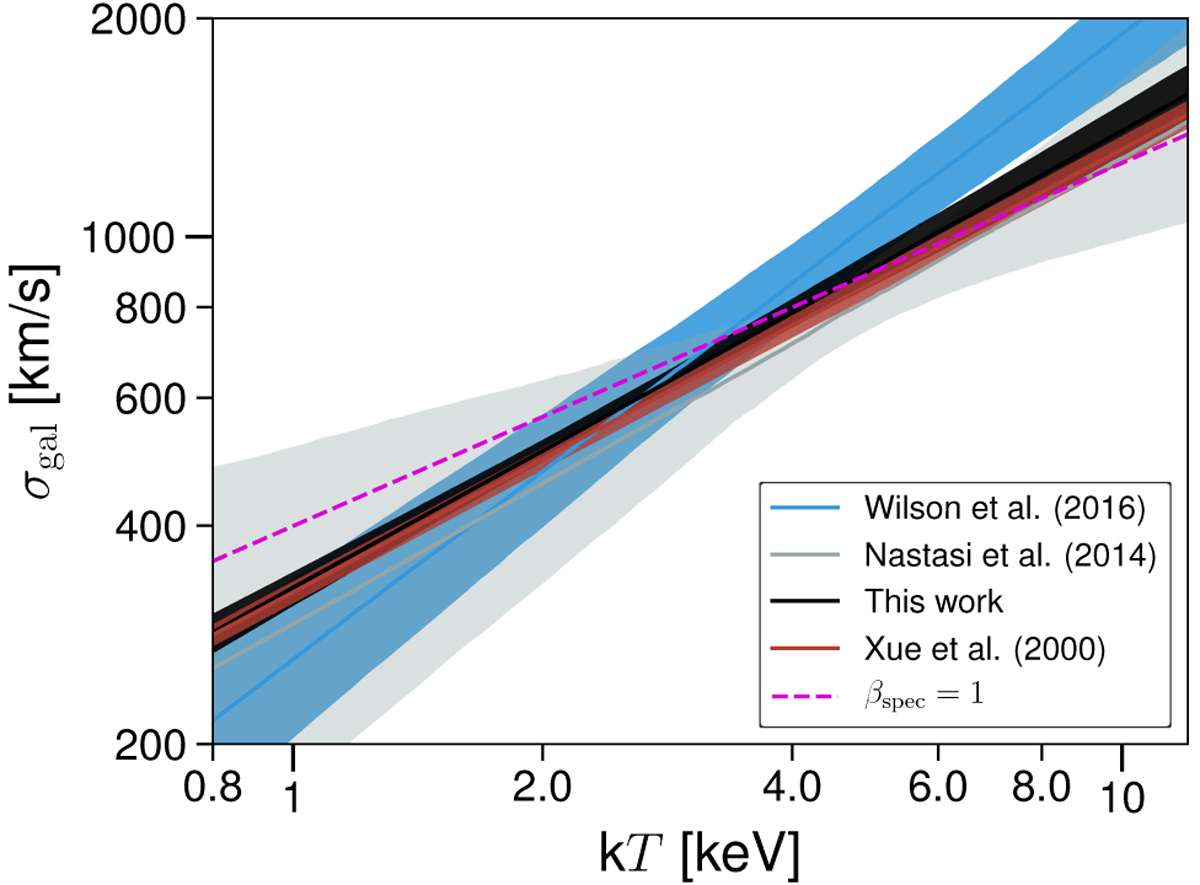
Comparison of the σgal − kT300 kpc scaling relation of this work with prior literature, as labeled. Shaded regions are 1σ uncertainty on the expected velocity dispersion at given temperature. The magenta line is the locus of constant specific energy ratio,![]() with μ = 0.6. The slope ofWilson et al. (2016) suffers from a potential bias discussed in the text.
with μ = 0.6. The slope ofWilson et al. (2016) suffers from a potential bias discussed in the text.
Current usage metrics show cumulative count of Article Views (full-text article views including HTML views, PDF and ePub downloads, according to the available data) and Abstracts Views on Vision4Press platform.
Data correspond to usage on the plateform after 2015. The current usage metrics is available 48-96 hours after online publication and is updated daily on week days.
Initial download of the metrics may take a while.