Fig. 5
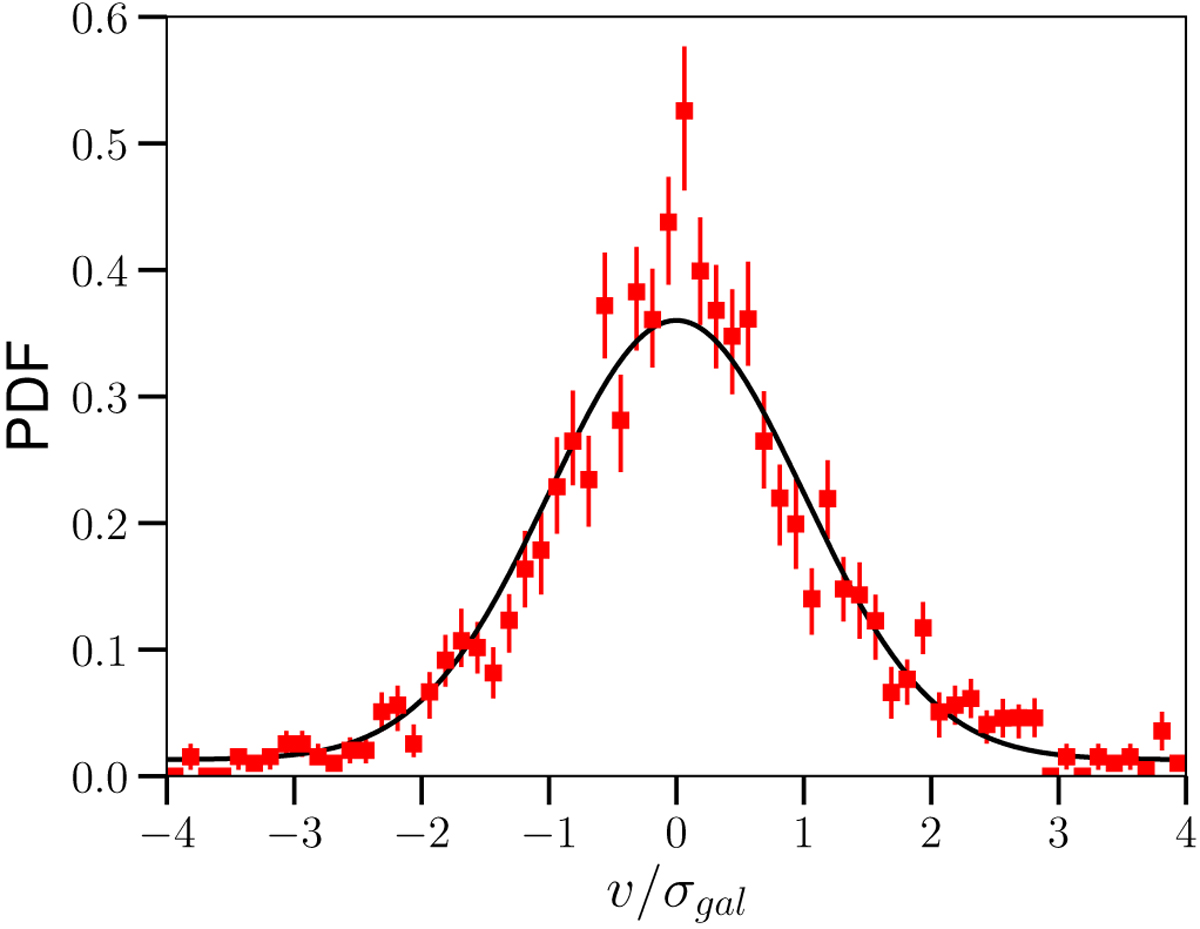
Normalised residuals of galaxy velocity about the mean scaling relation in the fiducial analysis. Red points show the data and the black line is the model, Eq. (4), a mixture of a Gaussian and a uniform distribution. Error bars are calculated by bootstrapping the velocities of the spectroscopic sample, using 64 bins between − 4 and 4 in vgal ∕σgal. See text for discussion of the goodness of fit.
Current usage metrics show cumulative count of Article Views (full-text article views including HTML views, PDF and ePub downloads, according to the available data) and Abstracts Views on Vision4Press platform.
Data correspond to usage on the plateform after 2015. The current usage metrics is available 48-96 hours after online publication and is updated daily on week days.
Initial download of the metrics may take a while.