Fig. 3
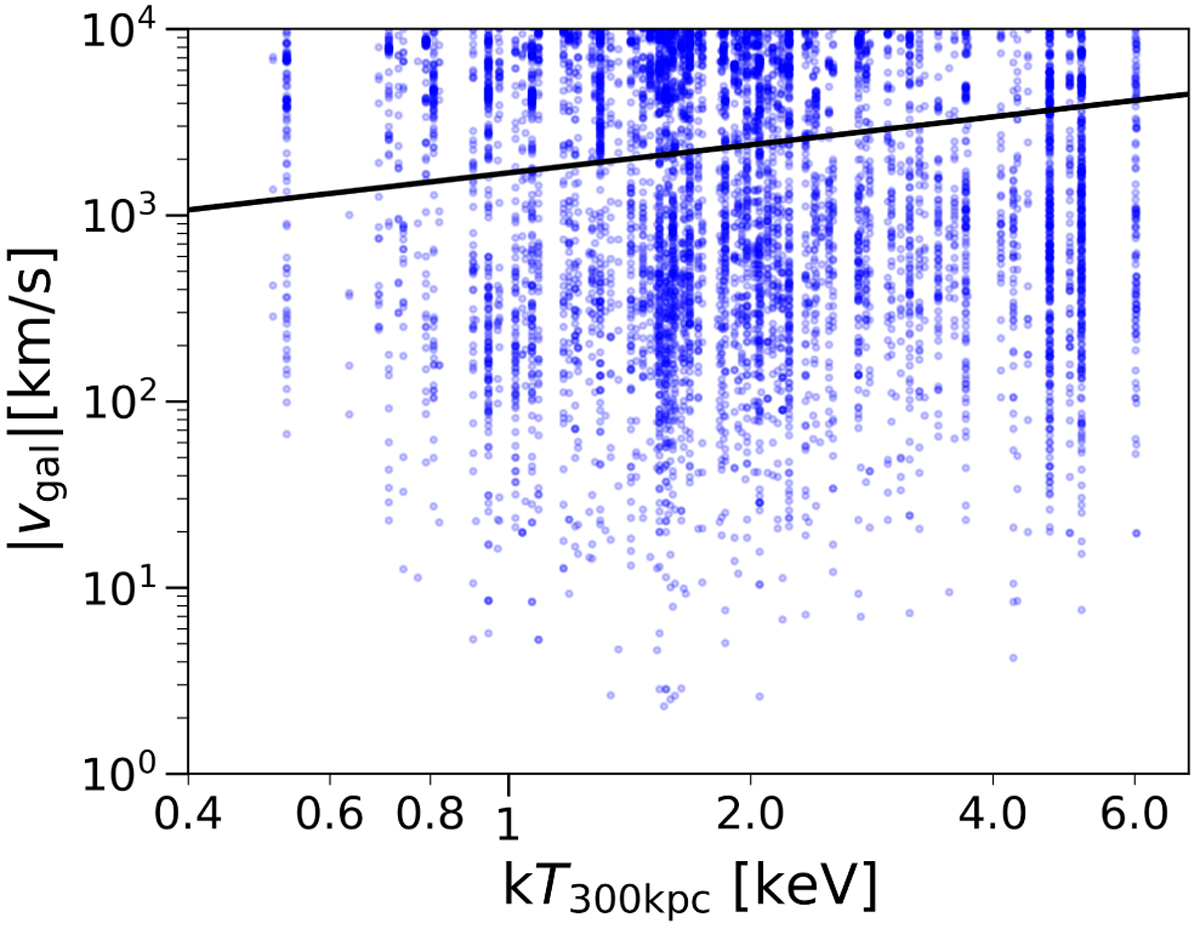
Magnitude of the rest-frame velocity of cluster galaxies, Eq. (1), as a function of cluster temperature. Each dot is one galaxy, and some galaxies appear in the fields of multiple clusters. The black line shows the cut, Eq. (2), that separates the lower signal population from a projected background. Points above the black line are disregarded in our analysis.
Current usage metrics show cumulative count of Article Views (full-text article views including HTML views, PDF and ePub downloads, according to the available data) and Abstracts Views on Vision4Press platform.
Data correspond to usage on the plateform after 2015. The current usage metrics is available 48-96 hours after online publication and is updated daily on week days.
Initial download of the metrics may take a while.