Free Access
Fig. 1
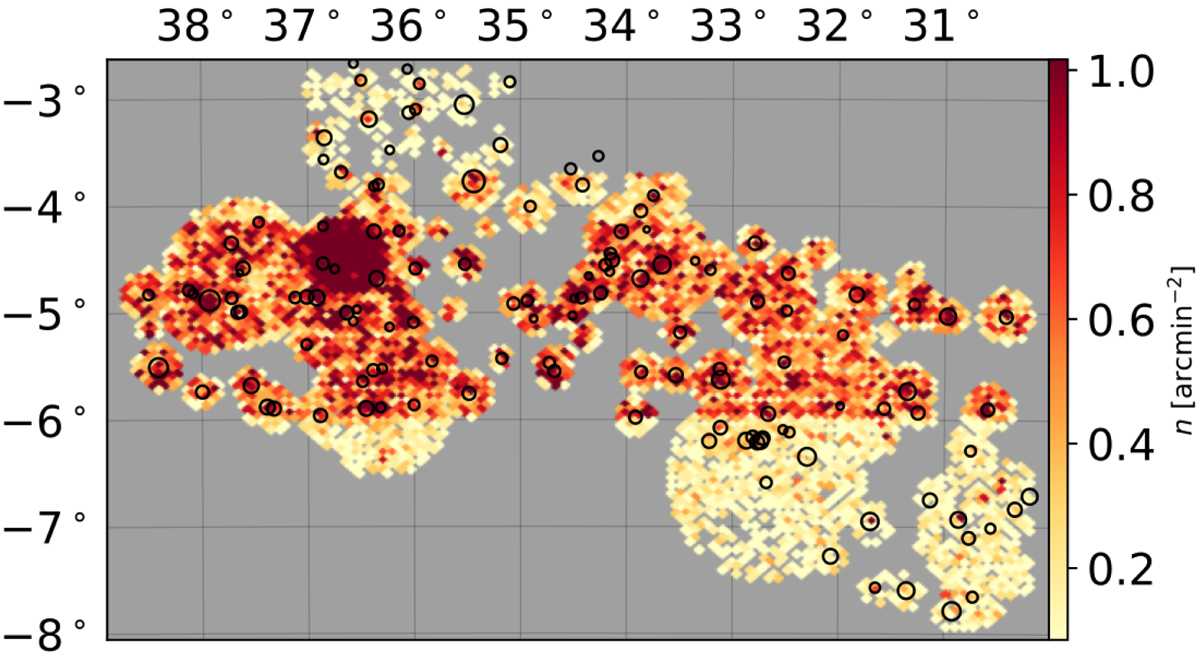
Spatial distribution of galaxies and clusters in the XXL north field used in this work. Black circles show cluster centres with z ≤ 0.6 with area proportional to temperature. The heat map shows the sky surface density of spectroscopic galaxies lying within a projected aperture of 3r500 around cluster centres.
Current usage metrics show cumulative count of Article Views (full-text article views including HTML views, PDF and ePub downloads, according to the available data) and Abstracts Views on Vision4Press platform.
Data correspond to usage on the plateform after 2015. The current usage metrics is available 48-96 hours after online publication and is updated daily on week days.
Initial download of the metrics may take a while.