Fig. 6
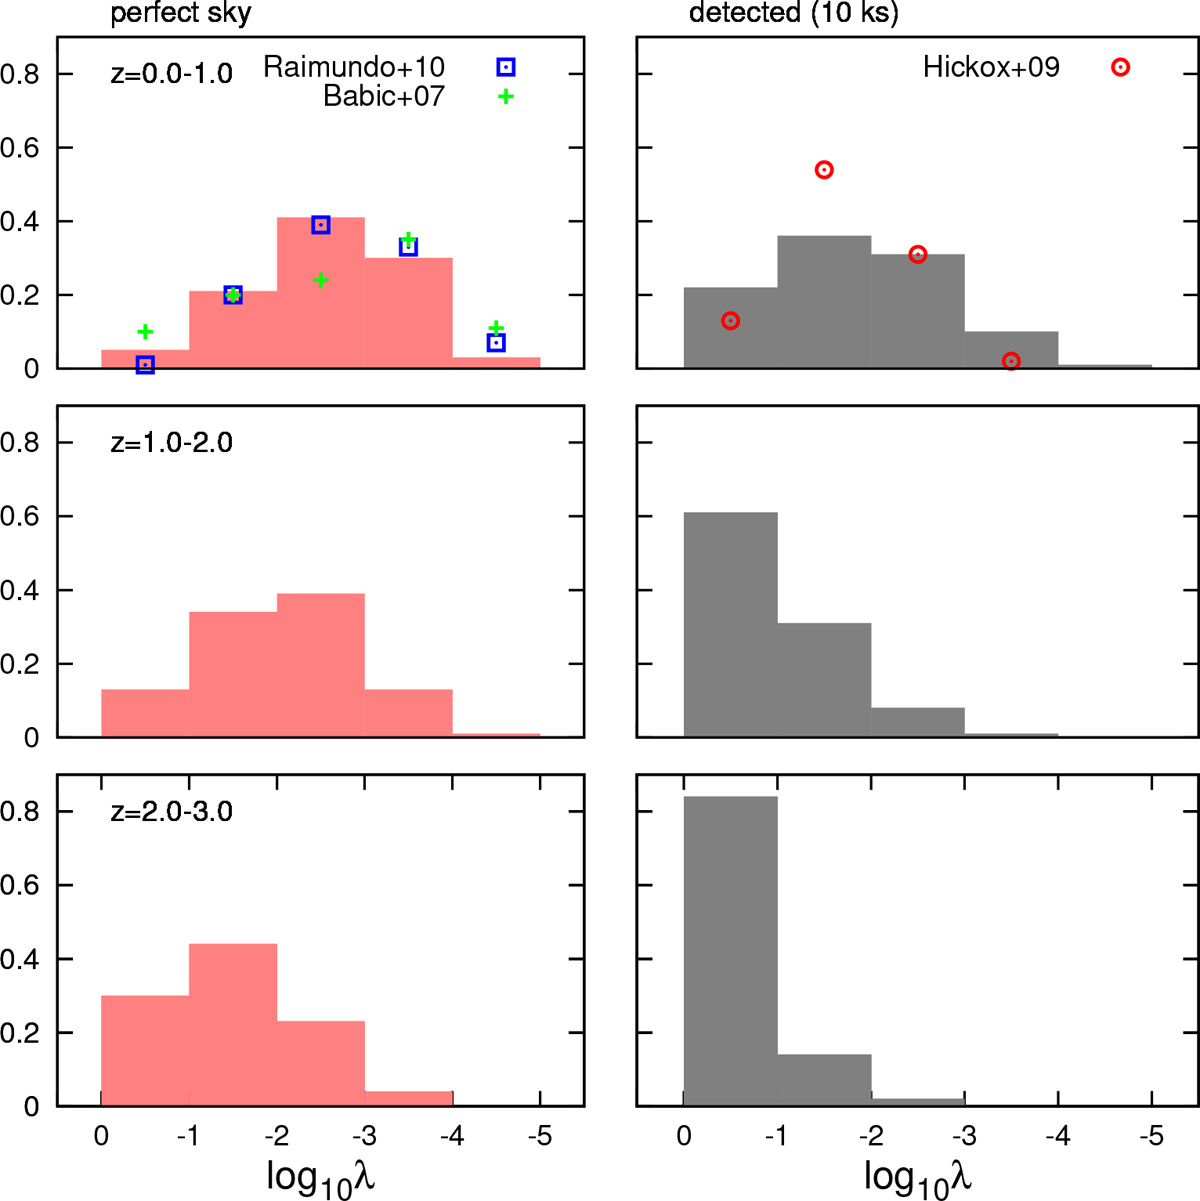
Eddington ratio distribution of the X-ray AGN within three redshift bins. On the left panels we plot the perfect-sky distribution and on the right panels the distribution after all observational and XMM-Newton instrumental effects were simulated (10 ks exposures, see Sect. 3.3). To illustrate observational selection effects, we overplot deep observational data on the perfect-sky distribution, and shallow on the 10 ks exposures (see Sect. 4.2 for more discussion).
Current usage metrics show cumulative count of Article Views (full-text article views including HTML views, PDF and ePub downloads, according to the available data) and Abstracts Views on Vision4Press platform.
Data correspond to usage on the plateform after 2015. The current usage metrics is available 48-96 hours after online publication and is updated daily on week days.
Initial download of the metrics may take a while.