Fig. 5
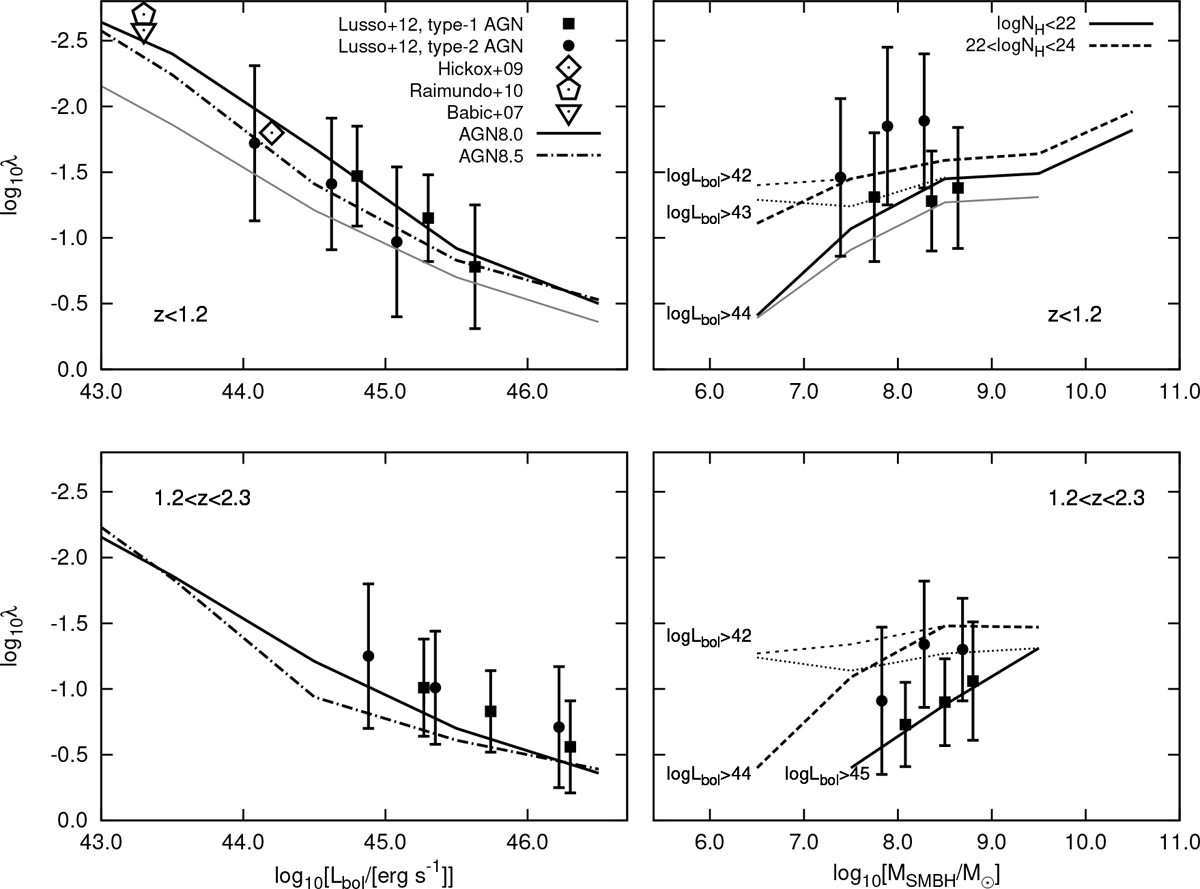
Eddington ratio vs. bolometric luminosity (left panels) and black hole mass (right panels). The simulated AGN sample was divided in two redshift bins, z < 1.2 (top panels) and 1.2 < z < 2.3 (bottom panels), and in unobscured (type-1, NH < 1022 cm−2) and obscured (type-2, 1022 cm−2 > NH > 1022 cm−2) sources, to match the L12 samples (circles and squares, mean values with 1σ errors). X-ray luminosity lower-limits (as marked on the plots) were also imposed for the same reason. When the lower-luminosity limits are relaxed the results are shown with dotted (type-1) and dashed lines (type-2). Obscuration does not affect the results plotted on the left, therefore only one line is drawn for the two samples. The gray lines are the respective results of the type-1 sample at the high-z range, plotted to demonstrate the evolution. We also plot the results of the AGN8.5 model (dash-dotted lines) and the mean λ values (not corrected for incompleteness) of previous studies at the mean luminosities of their samples. See Sect. 4.2 for more discussion on the observed trends.
Current usage metrics show cumulative count of Article Views (full-text article views including HTML views, PDF and ePub downloads, according to the available data) and Abstracts Views on Vision4Press platform.
Data correspond to usage on the plateform after 2015. The current usage metrics is available 48-96 hours after online publication and is updated daily on week days.
Initial download of the metrics may take a while.