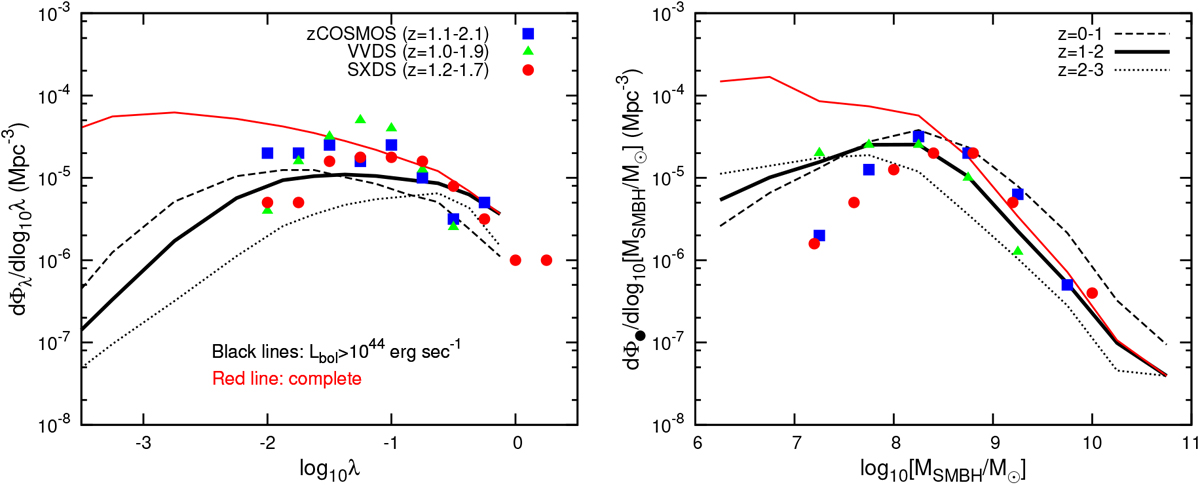
Fig. 4

ERDF (left panel) and BHMF (right panel) of broad-line AGN (type 1, NH < 1022 cm−2) between redshift 1 and 2 (black continuous line). We overplot relevant X-ray selected data from SXDS (red circles) and optically selected data from VVDS (green triangles) and zCOSMOS (blue squares), corrected for incompleteness with the 1/Vmax method. A luminosity limit of Lbol > 1044 erg s−1 was imposed on the simulation data according to the respective limitations of the above surveys. When the limit is relaxed (red line), the number of sources continuously increases towards low λ and low MSMBH. We also present the respective distributions of sources with z < 1 (dashed line) and z > 2 (dotted line).
Current usage metrics show cumulative count of Article Views (full-text article views including HTML views, PDF and ePub downloads, according to the available data) and Abstracts Views on Vision4Press platform.
Data correspond to usage on the plateform after 2015. The current usage metrics is available 48-96 hours after online publication and is updated daily on week days.
Initial download of the metrics may take a while.


