Fig. 2
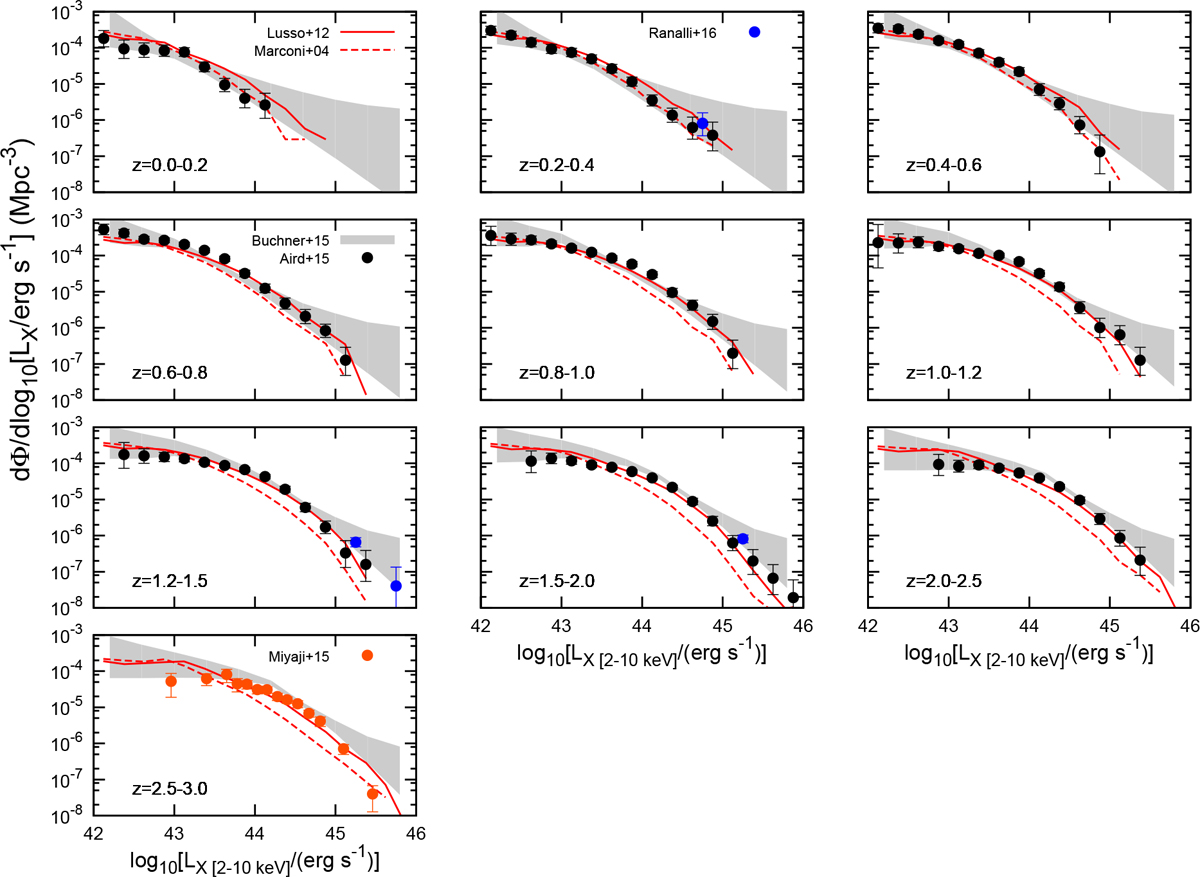
2–10 keV unabsorbed X-ray luminosity functions of synthetic and observed AGN. The panels correspond to redshift bins up to redshift 3. The results of our modeling with cosmo-OWLS data are marked with red lines (continuous for bolometric corrections based on L12, dashed for M04). Black circles (with 1σ errors) denote the intrinsic hard XLF by Aird et al. (2015). In the last redshift bin (last panel) we plot data from Miyaji et al. (2015, orange circles), which span a more pertinent redshift range. The grey bands indicate the 90% confidence interval of a non-parametric fit of observational data by Buchner et al. (2015). For comparison, we also plot data points (blue circles) by Ranalli et al. (2016, with 1σ errors) at the bright-end of the XLF (the 11 deg2 of the XMM-LSS survey were used).
Current usage metrics show cumulative count of Article Views (full-text article views including HTML views, PDF and ePub downloads, according to the available data) and Abstracts Views on Vision4Press platform.
Data correspond to usage on the plateform after 2015. The current usage metrics is available 48-96 hours after online publication and is updated daily on week days.
Initial download of the metrics may take a while.