Fig. 1
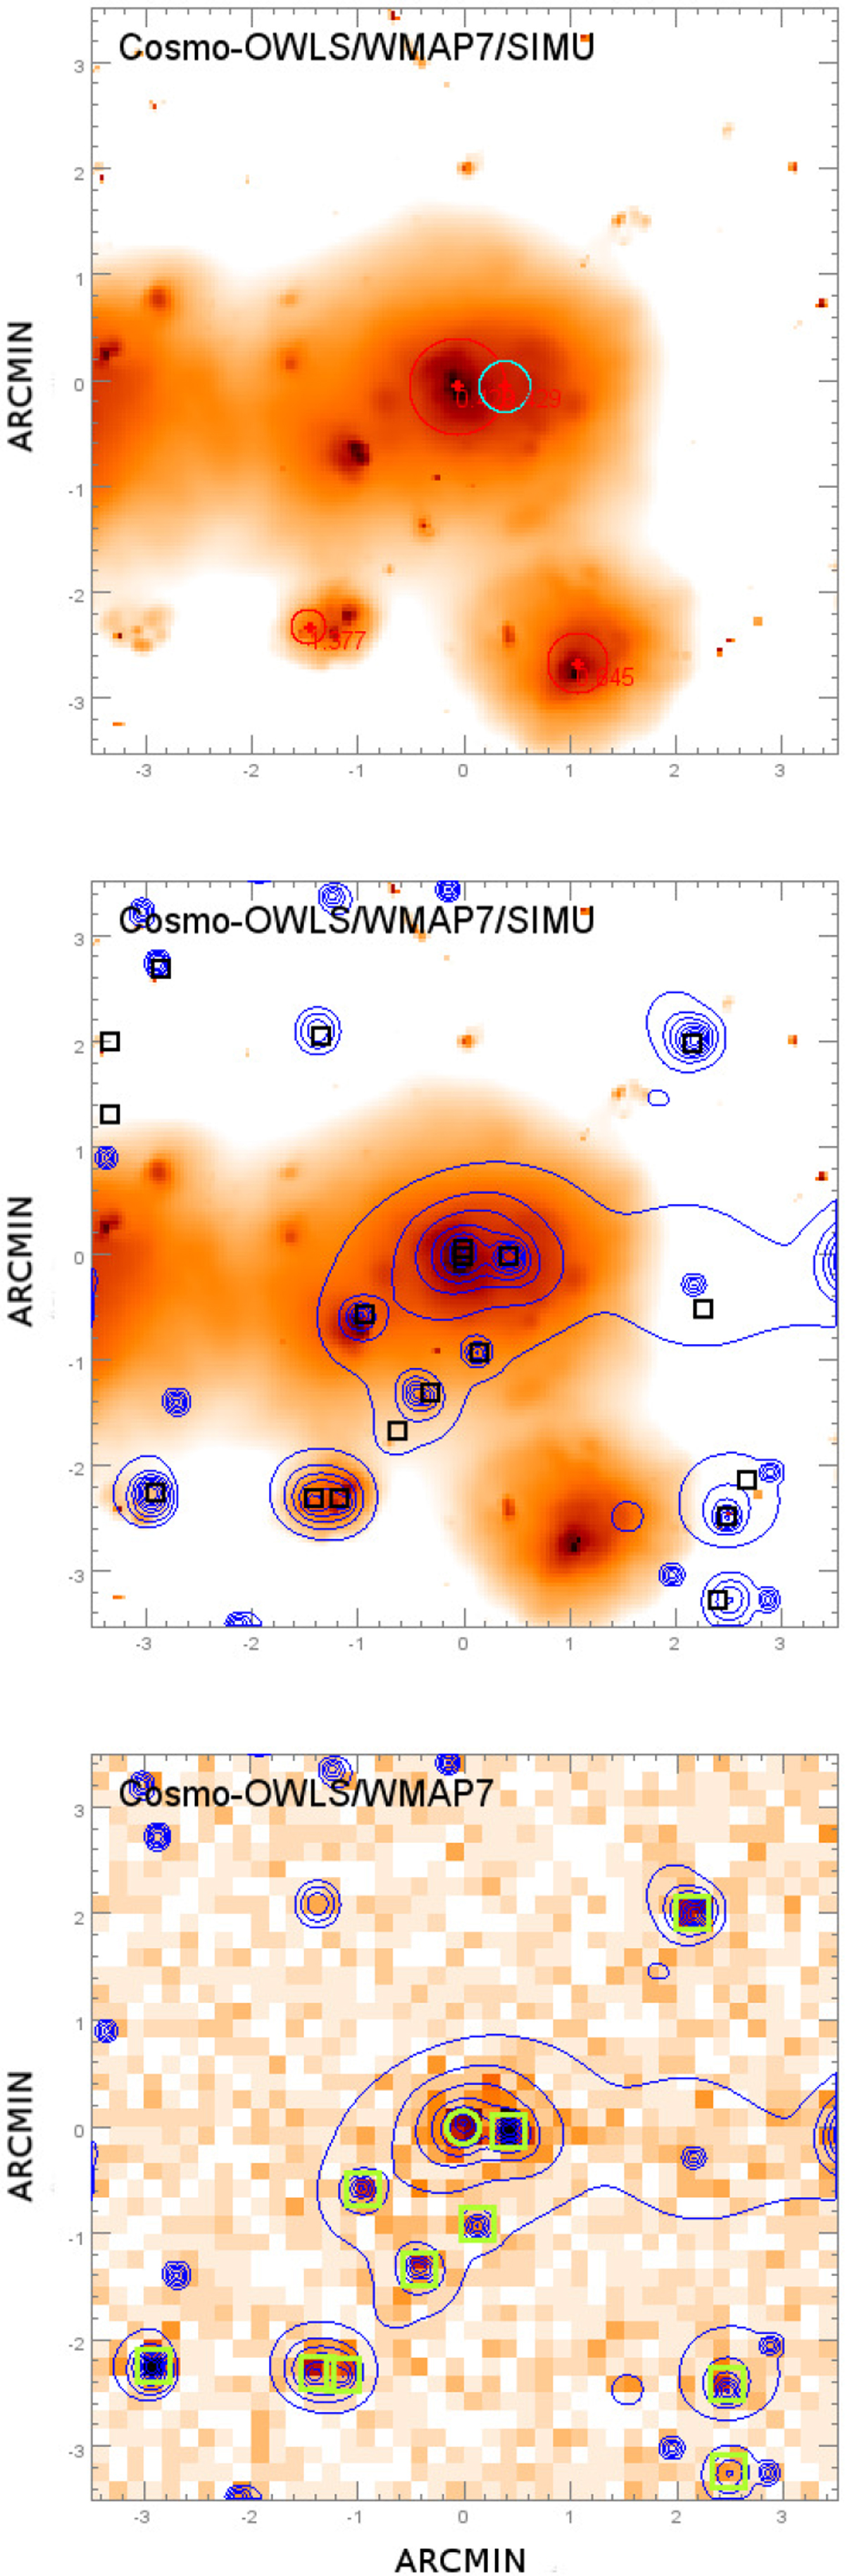
Simulated XMM-Newton images and source detection. Top: X-ray photon map from cosmo-OWLS overplotted with red (cyan) circles that mark the position and redshift of the input dark matter haloes (secondary haloes). The radius of each circle represents the r500 radius. Middle: same as top overplotted with the X-ray contours (10 ks exposure) and the position of the input simulated AGN (blacksquares). Bottom: same as top after including XMM-Newton instrumental effects and background. Green squares (circles) mark significant detections of point-like (extended) sources by the detection algorithm.
Current usage metrics show cumulative count of Article Views (full-text article views including HTML views, PDF and ePub downloads, according to the available data) and Abstracts Views on Vision4Press platform.
Data correspond to usage on the plateform after 2015. The current usage metrics is available 48-96 hours after online publication and is updated daily on week days.
Initial download of the metrics may take a while.