Free Access
Fig. 6.
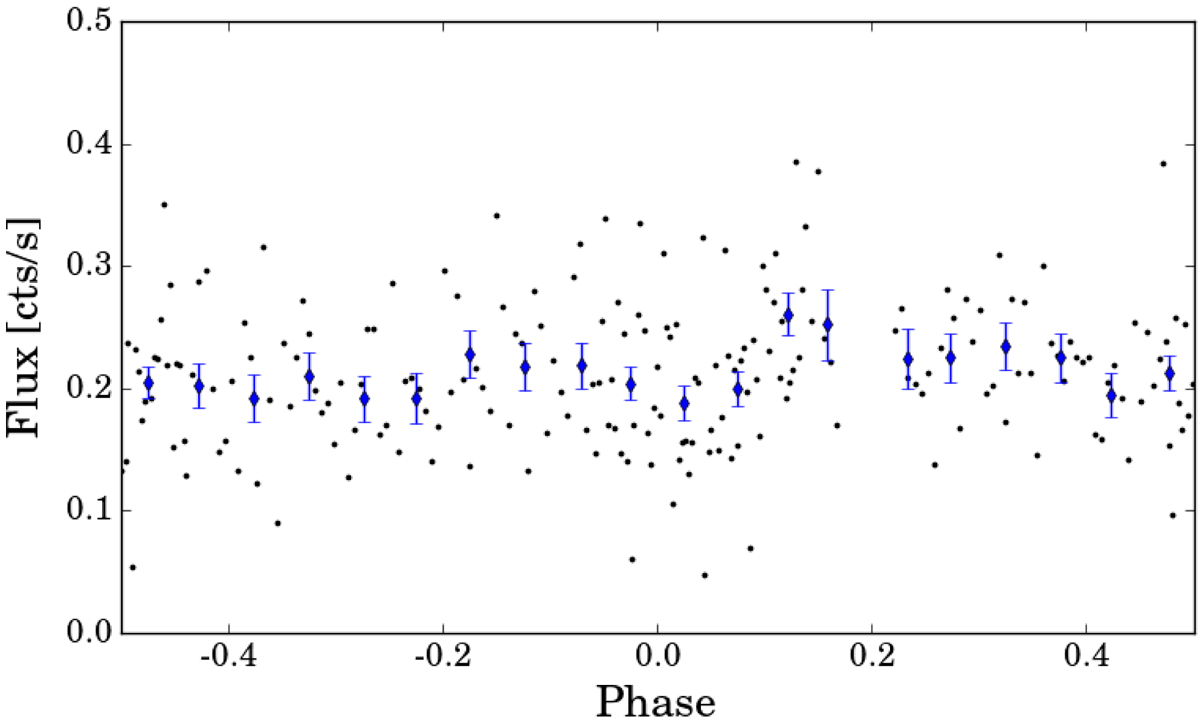
EPIC PN light curve of BX Tri folded with the period derived by Zhang et al. (2014) after flare removal. The black dots represent the filtered light curve with a binning of 100 s (error bars were omitted for clarity), while the blue diamonds show the phase-binned light curve.
Current usage metrics show cumulative count of Article Views (full-text article views including HTML views, PDF and ePub downloads, according to the available data) and Abstracts Views on Vision4Press platform.
Data correspond to usage on the plateform after 2015. The current usage metrics is available 48-96 hours after online publication and is updated daily on week days.
Initial download of the metrics may take a while.