Free Access
Fig. 3.
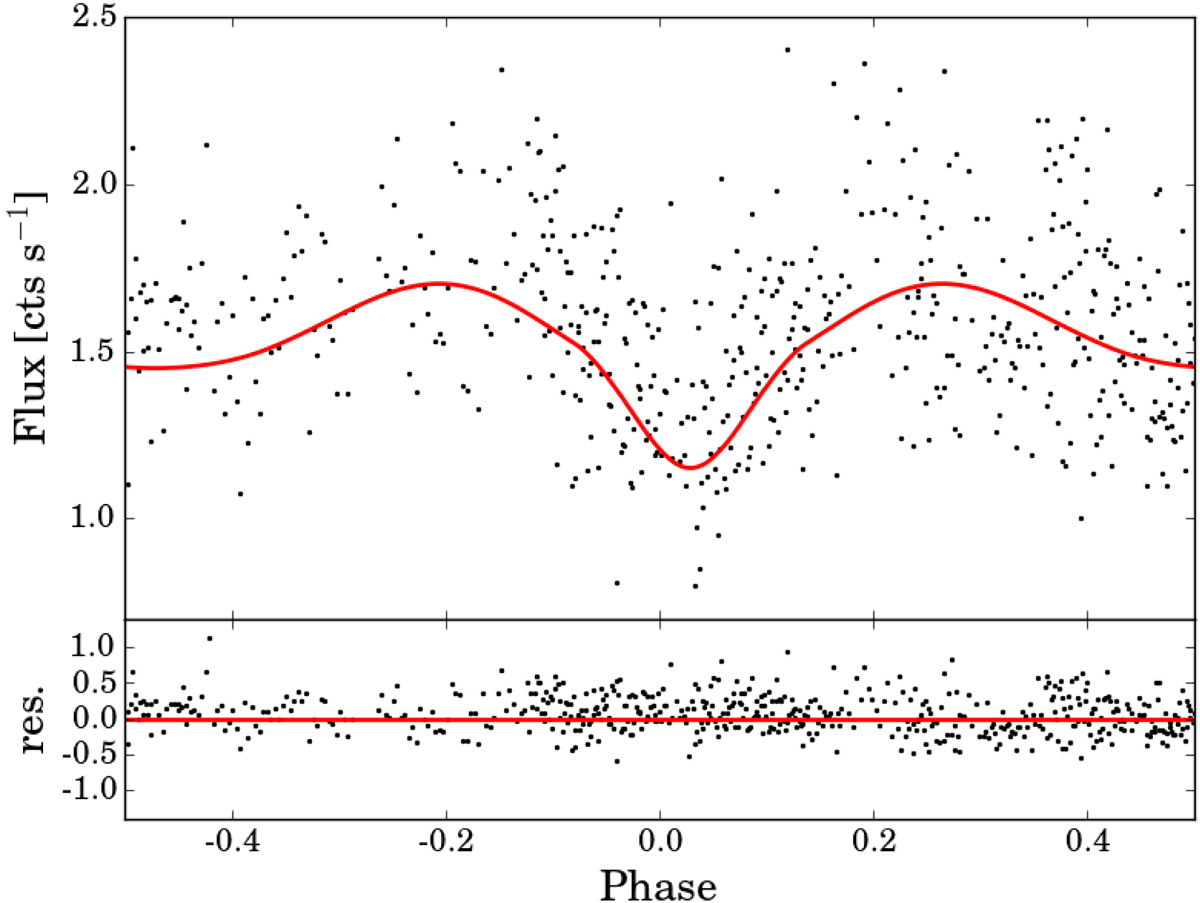
Optical monitor light curve folded with the period given by Zhang et al. (2014). The solid red line represents the PHOEBE model and the residuals between the flux and the unshifted model are displayed in the bottom panel. Regions with flaring events were omitted.
Current usage metrics show cumulative count of Article Views (full-text article views including HTML views, PDF and ePub downloads, according to the available data) and Abstracts Views on Vision4Press platform.
Data correspond to usage on the plateform after 2015. The current usage metrics is available 48-96 hours after online publication and is updated daily on week days.
Initial download of the metrics may take a while.