Fig. 6.
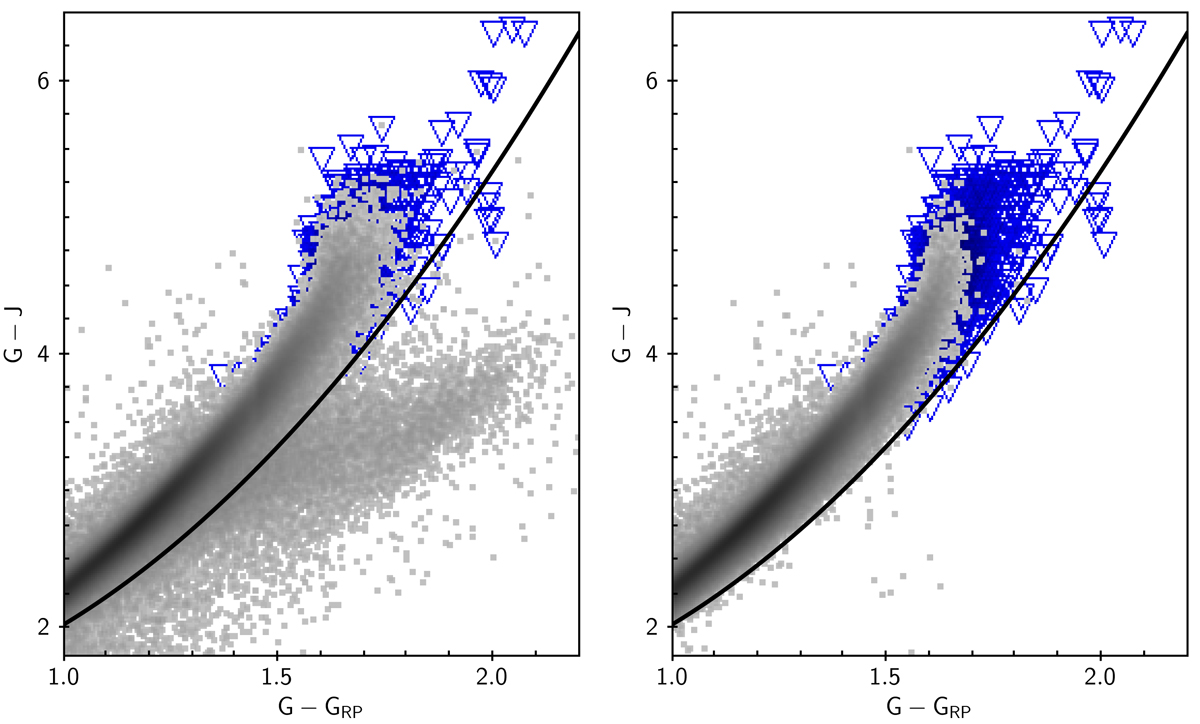
G−J vs. G−G RP diagram at the low-mass end. The open triangles show previously known objects found in Gaia DR2 (see Sect. 2). The dots show the filtered Gaia DR2 catalog with a 2MASS counterpart and a 2MASS photometric quality flag Q fl = AAA, before (left panel), and after (right panel) removing objects with an RP/BP flux excess following Evans et al. (2018). The curve shows the empirical limit we used to filter objects with spurious colors.
Current usage metrics show cumulative count of Article Views (full-text article views including HTML views, PDF and ePub downloads, according to the available data) and Abstracts Views on Vision4Press platform.
Data correspond to usage on the plateform after 2015. The current usage metrics is available 48-96 hours after online publication and is updated daily on week days.
Initial download of the metrics may take a while.