Fig. 3.
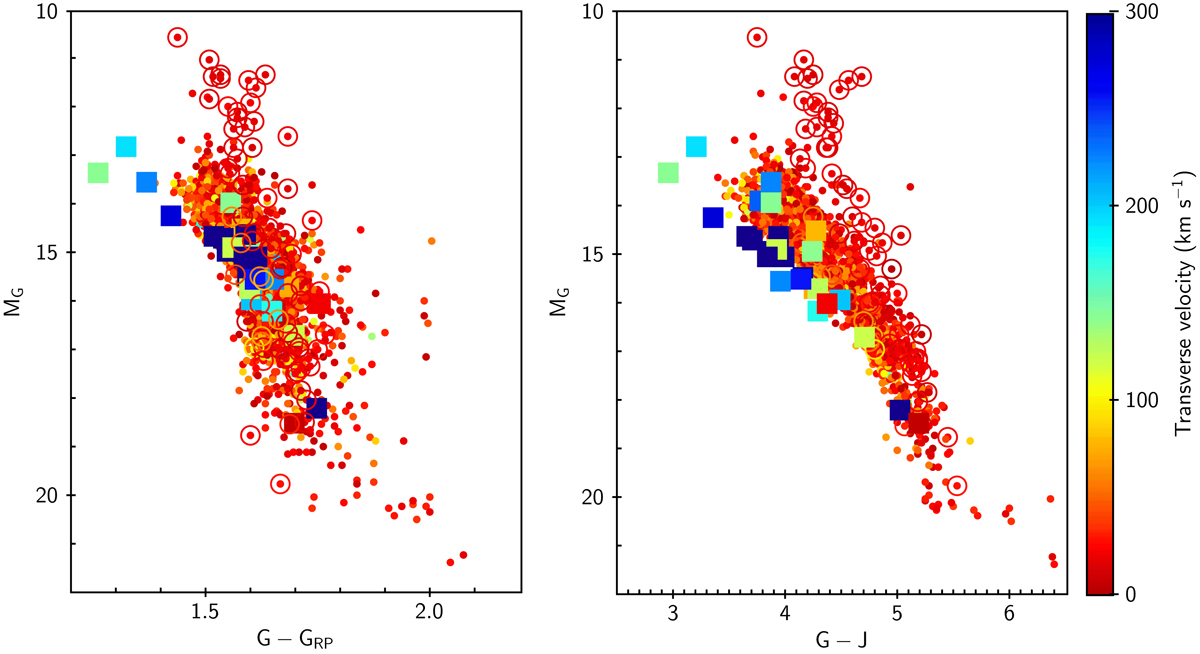
HR diagram of the known sample found in Gaia DR2 (restricted to the sub-sample with σ ϖ ≤ 10%), using the G − G RP (left panel) and G − J (right panel) color index. The color bar gives the transverse velocity range. Filled squares are objects listed as subdwarfs in the census, and open circles are objects listed as young candidates.
Current usage metrics show cumulative count of Article Views (full-text article views including HTML views, PDF and ePub downloads, according to the available data) and Abstracts Views on Vision4Press platform.
Data correspond to usage on the plateform after 2015. The current usage metrics is available 48-96 hours after online publication and is updated daily on week days.
Initial download of the metrics may take a while.