| Issue |
A&A
Volume 619, November 2018
|
|
|---|---|---|
| Article Number | A177 | |
| Number of page(s) | 5 | |
| Section | Stellar structure and evolution | |
| DOI | https://doi.org/10.1051/0004-6361/201834062 | |
| Published online | 22 November 2018 | |
A closer look at the transition between fully convective and partly radiative low-mass stars
1
University of Exeter, Physics and Astronomy, EX4 4QL Exeter, UK
e-mail: This email address is being protected from spambots. You need JavaScript enabled to view it.
2
École Normale Supérieure, Lyon, CRAL (UMR CNRS 5574), Université de Lyon, France
Received:
9
August
2018
Accepted:
19
September
2018
Abstract
Recently, an analysis of Gaia Data Release 2 revealed a gap in the mid-M dwarf main sequence. The authors suggested the feature is linked to the onset of full convection in M dwarfs. Following the announcement of this discovery, an explanation has been proposed based on standard stellar evolution models. In this paper we re-examine this explanation. We confirm that nuclear burning and mixing processes of 3He provide the best explanation for the observed feature. We also find that a change in the energy transport from convection to radiation does not induce structural changes that could be visible. Regarding the very details of the process, however, we disagree with the details of the published explanation and propose an alternative.
Key words: stars: low-mass / stars: evolution / Hertzsprung-Russell and C-M diagrams / convection
© ESO 2018
1. Introduction
The wealth of precise all-sky data from the Gaia Data Release 2 (DR2) revealed a new feature in the Herzsprung–Russell diagram (HRD), namely a gap in the mid-M dwarf main sequence (Jao et al. 2018). The gap appears at a magnitude MG ∼ 10 and colour GBP – GRP ∼ 2.3−2.5 in the Gaia filter system. It is observed in optical and near-infrared colour-magnitude diagrams (CMDs), indicating that it is not specific to the Gaia photometry and not due to an atmospheric feature that would depend on the wavelength. Jao et al. (2018) suggest the feature is linked to the onset of full convection in M dwarfs. Interestingly, Mayne (2010) was the first to suggest the existence of an observational signature for the transition between fully and partly convective structures for pre-main sequence stars and predicted that it would result in a HRD gap. This author explored signatures of this transition in young clusters and linked the growth of a radiative core to rapid change in effective temperature caused by changes in the dominant energy transport mechanism and ignition of hydrogen burning. Following the announcement of the HRD gap discovery by Jao et al. (2018), MacDonald & Gizis (2018) proposed an explanation based on standard stellar evolution models. They suggest that the observed feature is due to the complex interplay between production of 3He and its transport by convection. More specifically, they predict a fast change in the luminosity over a narrow mass range of ∼0.31 M⊙−0.34 M⊙ characterised by the presence of a convective core and a convective envelope that ultimately merge. During this merging process, the central 3He abundance increases, causing an increase in luminosity and thus an observable feature in the luminosity function. In this paper, we re-examine the explanation suggested by MacDonald & Gizis (2018), since at first sight it is not clear why a sudden increase of the luminosity due to the merging of the convective zones of the core and the envelope would create a dip in the luminosity function, and thus a gap in the HRD. In this analysis, we confirm that the best explanation for the observed feature is linked to the property of 3He nuclear production and destruction, and to its mixing. We also find that a change in the energy transport from convection to radiation does not induce structural changes that could be visible. Regarding the very details of the process, however, we disagree with MacDonald & Gizis (2018) and propose an alternative explanation.
2. Evolutionary models
Evolutionary calculations are based on the evolutionary code and input physics appropriate to the interior structures of low-mass stars and substellar objects described in detail in Chabrier & Baraffe (1997) and Baraffe et al. (1998). Below, we briefly recall the main input physics. Models are based on the equation of state from Saumon et al. (1995), and the Rosseland mean opacities of Iglesias & Rogers (1996) and Ferguson et al. (2005). Convective energy transport is described by the mixing length theory, adopting a mixing length lmix = 1.6 × HP, with HP being the pressure scale height. The onset of convective instability is determined by the Schwarzschild criterion. Outer boundary conditions are based on the atmosphere models described in Baraffe et al. (2015). Models have an initial helium abundance of Y = 0.28 in mass fraction and solar metallicity. The only difference in this work compared to the recent models of Baraffe et al. (2015) is the refinement of the mass grid between 0.25 and 0.4 M⊙, using presently a spacing of 0.01 M⊙, instead of the 0.1 M⊙ previously used, to better describe the transition from fully to partly convective interior structures.
2.1. Evolution with time: contraction toward the main sequence
Figure 1 shows the evolution of the radius as a function of time in the transition region. All models with M ∼ 0.28 M⊙ start to develop a radiative core; the lower the mass, the later the appearance of the radiative core. As explained in Chabrier & Baraffe (1997), the development of a radiative core stems from the decrease of the opacities after the last bump due to metals, for central temperatures Tc ≳ 4 × 10⁶ K. In the mass range ∼0.28−0.35 M⊙, the radiative core eventually disappears and the model becomes fully convective (see Fig. 2). Models with masses M ≳ 0.33 M⊙ also develop a convective core that will merge at some point with the convective envelope for M ≲ 0.35 M⊙, as noticed by MacDonald & Gizis (2018).
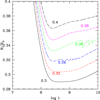 |
Fig. 1. Evolution of the radius with time (in yr) for low-mass star models in the transition region between fully and partly convective structures. Masses (in M⊙) are indicated close to each corresponding curve. |
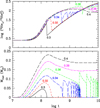 |
Fig. 2. Top panel: evolution with time (in yr) of the central 3He abundance (in log and normalised to the initial 3He abundance 3He0 = 2 × 10⁻⁵ in mass fraction). Bottom panel: evolution of the mass of the radiative core. The masses are as in Fig. 1. |
The evolution of the central abundance of 3He is particularly important in the present context. In this mass range, nuclear energy is produced by the PPI chain:
 (1)
(1)
 (2)
(2)
 (3)
(3)
We use the thermonuclear reaction rates from Caughlan & Fowler (1988), which for these specific reactions are very similar to the ones provided by another widely used compilation from Angulo et al. (1999, NACRE). In the relevant temperature range (106 K–107 K), the rates between these two compilations differ by less than 5%, 22%, and 7% for reactions (1), (2), and (3), respectively. Nuclear energy production by reaction (3) starts to be important for temperatures T ≳ 7.7 × 10⁶ K, that is, for M ≳ 0.33 M⊙. Contribution of reaction (3) to the total nuclear energy production is what drives the development of a convective core. A simple test setting the energy production by reaction (3) to zero indeed suppresses the development of a convective core in the mass range of interest. As long as 3He has not reached equilibrium, its abundance increases with temperature. Once equilibrium is reached, the abundance of 3He decreases as temperature increases (see e.g. Clayton 1968). At the onset of the convective core, the lifetime of 3He against destruction by reaction (3) is ∼3 × 10⁸ yr (e.g. for 0.4 M⊙) to ∼109 yr (e.g. for 0.33 M⊙) in the very centre, and increases rapidly as a function of radius as temperature decreases toward the outer layers. As the convective core grows in mass, the average lifetime of 3He against destruction in the central core is still too long, compared to the age of the model, to enable 3He to reach equilibrium. This implies that as central temperature increases during the contraction phase toward the main sequence (typically for ages ≲ 1 Gyr), the central abundance of 3He increases with time (see Fig. 2). In addition, because 3He has still not reached equilibrium in the convective core (and thus its abundance increases with temperature), its abundance is maximum in the convective core and decreases as a function of radius, with a lower abundance in the convective envelope.
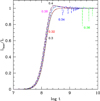 |
Fig. 3. Evolution with time (in yr) of the nuclear luminosity divided by the total luminosity. Masses are as in Fig. 1. |
For masses M ≳ 0.34 M⊙, reaction (3) provides a significant contribution to the total nuclear energy production by the PPI chain. The continuous increase with time of the central abundance of 3He results in an overproduction of nuclear energy in the central regions for masses M ≳ 0.34 M⊙. Consequently, the nuclear luminosity Lnuc exceeds the total luminosity of the star L (see Fig. 3) as the model approaches the beginning of the main sequence (this can be defined by thermal equilibrium with Lnuc ∼ L). This yields a noticeable expansion (i.e. increase of the radius) of the models at ages log t ∼ 8.4−9 compared to their lower mass, fully convective counterparts (see Fig. 1).
For models with M ≲ 0.33 M⊙, which become fully convective when reaching the main sequence, the contribution of Eq. (3) to the nuclear energy production remains small. When the radiative core disappears, the strong drop in the central abundance of 3He due to the mixing of envelope material, which contains lower abundance of 3He compared to the central regions, has no particular effect on the total nuclear luminosity, as seen in Fig. 3.
The intermediate cases (M ∼ 0.34 M⊙−0.36 M⊙) show more complex behaviours with burst events due to episodic merging of the convective core and the envelope. This feature was initially discovered by van Saders & Pinsonneault (2012) who report the existence of a new instability near the fully convective boundary driven by 3He. van Saders & Pinsonneault (2012) published a detailed analysis of this instability, referring to it as the convective kissing instability. We confirm its existence using different stellar-evolution code and input physics. At each merging event, the central abundance of 3He suddenly drops due to central regions with higher abundance of 3He mixing with envelope material containing less 3He. This is where our results differ from MacDonald & Gizis (2018). The strong drop in central 3He leads to a drop in the nuclear energy production, as can be seen from the drop in Lnuc in Fig. 3 for the displayed 0.34 M⊙ and 0.36 M⊙ models. The effect is an overall contraction, impacting the radius evolution. We note that the Kelvin–Helmholtz timescale, τKH ∼ GM2/(RL), is of the order of a few 108 years for these low-mass stars approaching the main sequence, indicating that the change of conditions in the central region has effectively the time to induce the structural change in terms of radius, and thus luminosity, that we describe.
2.2. Mass-radius and mass-luminosity relationships
Understanding the evolution with models of different masses helps us to understand the properties of the mass-radius and mass-luminosity relationships discussed in this section. We suggest that two features shape these relationships. The first one (feature 1) is the expansion of models with M ≳ 0.34 M⊙ due to the fast increase of central 3He abundance, causing a fast increase in nuclear energy production. This evolution is different from the one followed by fully convective models with M ≲ 0.33 M⊙, which evolve at essentially constant radius during the first gigayear of evolution. The second feature (feature 2) is the significant drop in radius during the episodic event of the merging of the convective core and the envelope, which only concerns the narrow mass range M ∼ 0.34 M⊙−0.36 M⊙. Inspection of the mass radius (Fig. 4) and mass-luminosity (Fig. 5) relationships at different ages reveals these two features. Feature 1 is most visible for ages ≲ 3 Gyr, with the M−R and M−L relationships lying slightly above the straight dashed line (added as a guide for the eye) for M > 0.36 M⊙ and lying below it for M < 0.35 M⊙. This is the signature of the expansion that only proceeds above the fully/partly convective transition. Feature 2 could be seen at all ages in the range ∼1–7 Gyr , contributing to a dip in the M−R and M−L relationships, but in a very narrow mass range.
In order to verify the key role played by 3He destruction/production in the present context, we performed a test in which 3He was forced to reach equilibrium. This was achieved by multiplying the reaction rate of reaction (3) by a factor 10 (but the reaction rate used for the calculation of the nuclear energy production remained unmodified). This forced 3He to reach equilibrium during the contraction phase toward the main sequence, with the central abundance of 3He rapidly reaching a maximum. The approach to the main sequence proceeded without the strong expansion reported for M ≳ 0.35 M⊙. In this test, the transition between fully and partly convective models took place at M ∼ 0.34 M⊙. Convective cores did not develop because of the limitation of 3He production. There were therefore no episodic events of convective core and envelope merging and the evolution in the transition region was smooth. No change of slope in the M−R and M−L relationships was observed in this test case (see dash-dotted curves in Figs. 4 and 5). This confirms the key role played by 3He in the transition region. It also confirms that the change of energy transport from convective to radiative transport in the central regions does not induce any visible structural change.
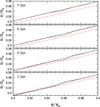 |
Fig. 4. Mass-radius relationships at different ages in the fully to partly convective transition region (solid line). We note that the mass grid uses a spacing of 0.01 M⊙. To highlight changes in the slope, the dashed curve is a straight line connecting values of the radius between 0.3 M⊙ and 0.4 M⊙. The dash-dotted (red) curves correspond to the test case where 3He is forced to reach equilibrium (see Sect. 2.2). |
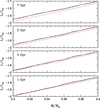 |
Fig. 5. Mass-luminosity relationships at different ages in the fully to partly convective transition region (solid line). The other curves have the same meaning as in Fig. 4. |
2.3. Colour-magnitude diagram
The features described in the previous section are visible in the CMD using the same Gaia filters as in Jao et al. (2018). The changes of slopes and the drop in magnitude for isochrones in the range of 1–7 Gyr take place at magnitudes MG ∼ 10−10.2 and colours GBP – GRP ∼ 2.3−2.4 (see Fig. 6), which nicely correspond to the location of the gap reported by Jao et al. (2018).
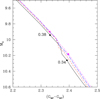 |
Fig. 6. Colour-magnitude diagram in the Gaia filter system for various isochrones. Black solid line: 1 Gyr; Red dash: 3 Gyr; Blue long dash: 5 Gyr; Magenta dash-dot: 7 Gyr. The symbols on the 1 Gyr and 7 Gyr curves indicate the position of models with 0.34 M⊙ and 0.38 M⊙, respectively. |
3. Discussion and conclusion
Confirmation that the two evolutionary features described in the previous section are the genuine explanation for the gap observed in the Gaia data requires the construction of synthetic CMDs. This will allow for their observational and statistical relevance to be tested, but is beyond the scope of present analysis. Here, we primarily aim to clarify the explanation provided by MacDonald & Gizis (2018). Given the very narrow mass range of models experiencing feature 2, that is, the merging of the convective core and the envelope, this may not be the most relevant feature in terms of statistics. It could, however, further contribute to the change of slope due to feature 1 in the M−R and M−L relationships predicted by models above M > 0.36 M⊙ and below M < 0.34 M⊙. The evolutionary features we find should be robust against changes in the input physics and variations of the metallicity around solar values. We verified this by running models in the same mass range, adopting the input physics of Baraffe et al. (1998), which use different atmosphere models for the outer boundary conditions and allow a comparison of results between solar [M/H] = 0 and subsolar [M/H] = −0.5 metallicities. The same qualitative evolutionary features are found with the Baraffe et al. (1998) input physics for both metallicities.
The exact location of the transition, in terms of mass and luminosity, from fully to partly convective inner structures, as well as the strength and number of convective core and envelope merging events will, however, depend on the input physics, the metallicity, and likely also on different numerical treatments of mixing in stellar evolution codes. We also find quantitative differences in the properties of the convective core and envelope merging events (e.g. time when the first event happens) depending on the choice of the numerical timestep and the grid resolution. van Saders & Pinsonneault (2012) present a detailed analysis of this instability and the quantitative differences that may result from different models; this is beyond the focus of our study.
Our interpretation differs from that provided by MacDonald & Gizis (2018). We find that the merging of the convective core with the envelope results in a decrease of 3He abundance in the centre and thus a decrease in luminosity. MacDonald & Gizis (2018) report the opposite because they find that 3He reaches quasi-equilibrium in the convective core in the initial main sequence evolution and that the abundance of 3He is larger above the convective core. Our estimates of the average lifetime of 3He against destruction by reaction (3) in the convective core, and the test we performed by forcing equilibrium, suggest that there is insufficient time to reach this latter state during the approach to the main sequence. We thus do not agree with their interpretation.
The discovery of the HRD gap by Jao et al. (2018) could have an impact in the field of cataclysmic variable (CV) systems (Knigge, priv. comm.). The complex behaviour of the mass-radius relationship that standard evolutionary models predict at the transition could affect the evolution of low-mass donors in CVs. Could this explain the famous CV period gap, namely the dearth of systems in the period range 2 h–3 h (King 1988; Knigge et al. 2011)? The most popular explanation is the disruption of magnetic breaking, the dominant mechanism for loss of angular momentum of these systems above the period gap, once the low-mass donor becomes fully convective. Although issues exist with this standard scenario (see discussion in Knigge et al. 2011), a better explanation has not yet been found. A small drop in radius as the CV donor becomes fully convective could provide an alternative explanation to the disruption of magnetic breaking, as it would cause detachment of the system and interruption of the mass transfer (and thus a period gap). Unfortunately, though the idea is extremely attractive, the central conditions of low-mass donors in CVs when they become fully convective are different from the conditions of their low-mass star counterparts which evolve at constant mass. Standard sequences following the evolution of low-mass donors above the period gap (see e.g. Baraffe & Kolb 2000) show that when the donor becomes almost fully convective, at a mass M ∼ 0.2 M⊙ and period P ∼ 3 h, the central temperature is too low (Tc ≲ 6 × 10⁶ K) for reaction (3) to be efficient and to provide the same mechanism as found for low-mass stars. The transition to a fully convective structure is therefore smooth with no obvious structural change that could induce a drop in radius for CV donors. van Saders & Pinsonneault (2012) also analysed the impact of the convective envelope/core merging events (their so-called convective kissing instability) on the evolution of CV secondaries. They suggest that the instability could play a role on CV secondaries close to the period gap, but only for extremely low mass-loss rates. Such low mass-loss rates seem rather unrealistic according to the exhaustive study of Knigge et al. (2011). In addition, their scenario would struggle to produce the observed gap width (between 2 h and 3 h). Indeed, with very low-mass transfers, the instability kicks in at a typical mass of 0.35 M⊙ (see Fig. 3 of van Saders & Pinsonneault 2012), which can provide the upper edge of a gap at 3 h if the system detaches. It seems however extremely difficult to obtain the lower edge of the gap (once the secondary shrinks back to its thermal equilibrium configuration and mass transfer resumes) at a period of 2 h with such a high mass.
Our explanations for the HRD gap still need to be confirmed with the generation of statistically significant synthetic CMDs. If confirmed, the observed signature of this transition provides excellent diagnostics of the central conditions of low-mass-star evolutionary models, since the present mechanisms highly depend on the central temperature and the evolution of both the convective core and the envelope. Rotational and magnetic properties of objects on either side of the HRD gap might also be affected, helping us to understand low-mass star properties when they become fully convective. A small gap in a CMD could therefore provide great insight into the interior structure of low-mass stars.
Acknowledgments
We thank Christian Knigge, Russel White, and Wei-Chun Jao for very useful discussions. This work is partly supported by the consolidated STFC grant ST/R000395/1 and the ERC grant No. 787361-COBOM.
References
- Angulo, C., Arnould, M., Rayet, M., et al. 1999, Nucl. Phys. A, 656, 3 [NASA ADS] [CrossRef] [Google Scholar]
- Baraffe, I., & Kolb, U. 2000, MNRAS, 318, 354 [NASA ADS] [CrossRef] [Google Scholar]
- Baraffe, I., Chabrier, G., Allard, F., & Hauschildt, P. H. 1998, A&A, 337, 403 [NASA ADS] [Google Scholar]
- Baraffe, I., Homeier, D., Allard, F., & Chabrier, G. 2015, A&A, 577, A42 [NASA ADS] [CrossRef] [EDP Sciences] [Google Scholar]
- Caughlan, G. R., & Fowler, W. A. 1988, At. Data Nucl. Data Tables, 40, 283 [Google Scholar]
- Chabrier, G., & Baraffe, I. 1997, A&A, 327, 1039 [NASA ADS] [Google Scholar]
- Clayton, D. D. 1968, Principles of stellar evolution and nucleosynthesis (Chicago: University of Chicago Press) [Google Scholar]
- Ferguson, J. W., Alexander, D. R., Allard, F., et al. 2005, ApJ, 623, 585 [NASA ADS] [CrossRef] [Google Scholar]
- Iglesias, C. A., & Rogers, F. J. 1996, ApJ, 464, 943 [NASA ADS] [CrossRef] [Google Scholar]
- Jao, W.-C., Henry, T. J., Gies, D. R., & Hambly, N. C. 2018, ApJ, 861, L11 [NASA ADS] [CrossRef] [Google Scholar]
- King, A. R. 1988, QJRAS, 29, 1 [NASA ADS] [Google Scholar]
- Knigge, C., Baraffe, I., & Patterson, J. 2011, ApJS, 194, 28 [NASA ADS] [CrossRef] [Google Scholar]
- MacDonald, J., & Gizis, J. 2018, MNRAS [Google Scholar]
- Mayne, N. J. 2010, MNRAS, 408, 1409 [NASA ADS] [CrossRef] [Google Scholar]
- Saumon, D., Chabrier, G., & van Horn, H. M. 1995, ApJS, 99, 713 [NASA ADS] [CrossRef] [Google Scholar]
- van Saders, J. L., & Pinsonneault, M. H. 2012, ApJ, 751, 98 [NASA ADS] [CrossRef] [Google Scholar]
All Figures
|
Fig. 1. Evolution of the radius with time (in yr) for low-mass star models in the transition region between fully and partly convective structures. Masses (in M⊙) are indicated close to each corresponding curve. |
| In the text | |
|
Fig. 2. Top panel: evolution with time (in yr) of the central 3He abundance (in log and normalised to the initial 3He abundance 3He0 = 2 × 10⁻⁵ in mass fraction). Bottom panel: evolution of the mass of the radiative core. The masses are as in Fig. 1. |
| In the text | |
|
Fig. 3. Evolution with time (in yr) of the nuclear luminosity divided by the total luminosity. Masses are as in Fig. 1. |
| In the text | |
|
Fig. 4. Mass-radius relationships at different ages in the fully to partly convective transition region (solid line). We note that the mass grid uses a spacing of 0.01 M⊙. To highlight changes in the slope, the dashed curve is a straight line connecting values of the radius between 0.3 M⊙ and 0.4 M⊙. The dash-dotted (red) curves correspond to the test case where 3He is forced to reach equilibrium (see Sect. 2.2). |
| In the text | |
|
Fig. 5. Mass-luminosity relationships at different ages in the fully to partly convective transition region (solid line). The other curves have the same meaning as in Fig. 4. |
| In the text | |
|
Fig. 6. Colour-magnitude diagram in the Gaia filter system for various isochrones. Black solid line: 1 Gyr; Red dash: 3 Gyr; Blue long dash: 5 Gyr; Magenta dash-dot: 7 Gyr. The symbols on the 1 Gyr and 7 Gyr curves indicate the position of models with 0.34 M⊙ and 0.38 M⊙, respectively. |
| In the text | |
Current usage metrics show cumulative count of Article Views (full-text article views including HTML views, PDF and ePub downloads, according to the available data) and Abstracts Views on Vision4Press platform.
Data correspond to usage on the plateform after 2015. The current usage metrics is available 48-96 hours after online publication and is updated daily on week days.
Initial download of the metrics may take a while.