Fig. 4.
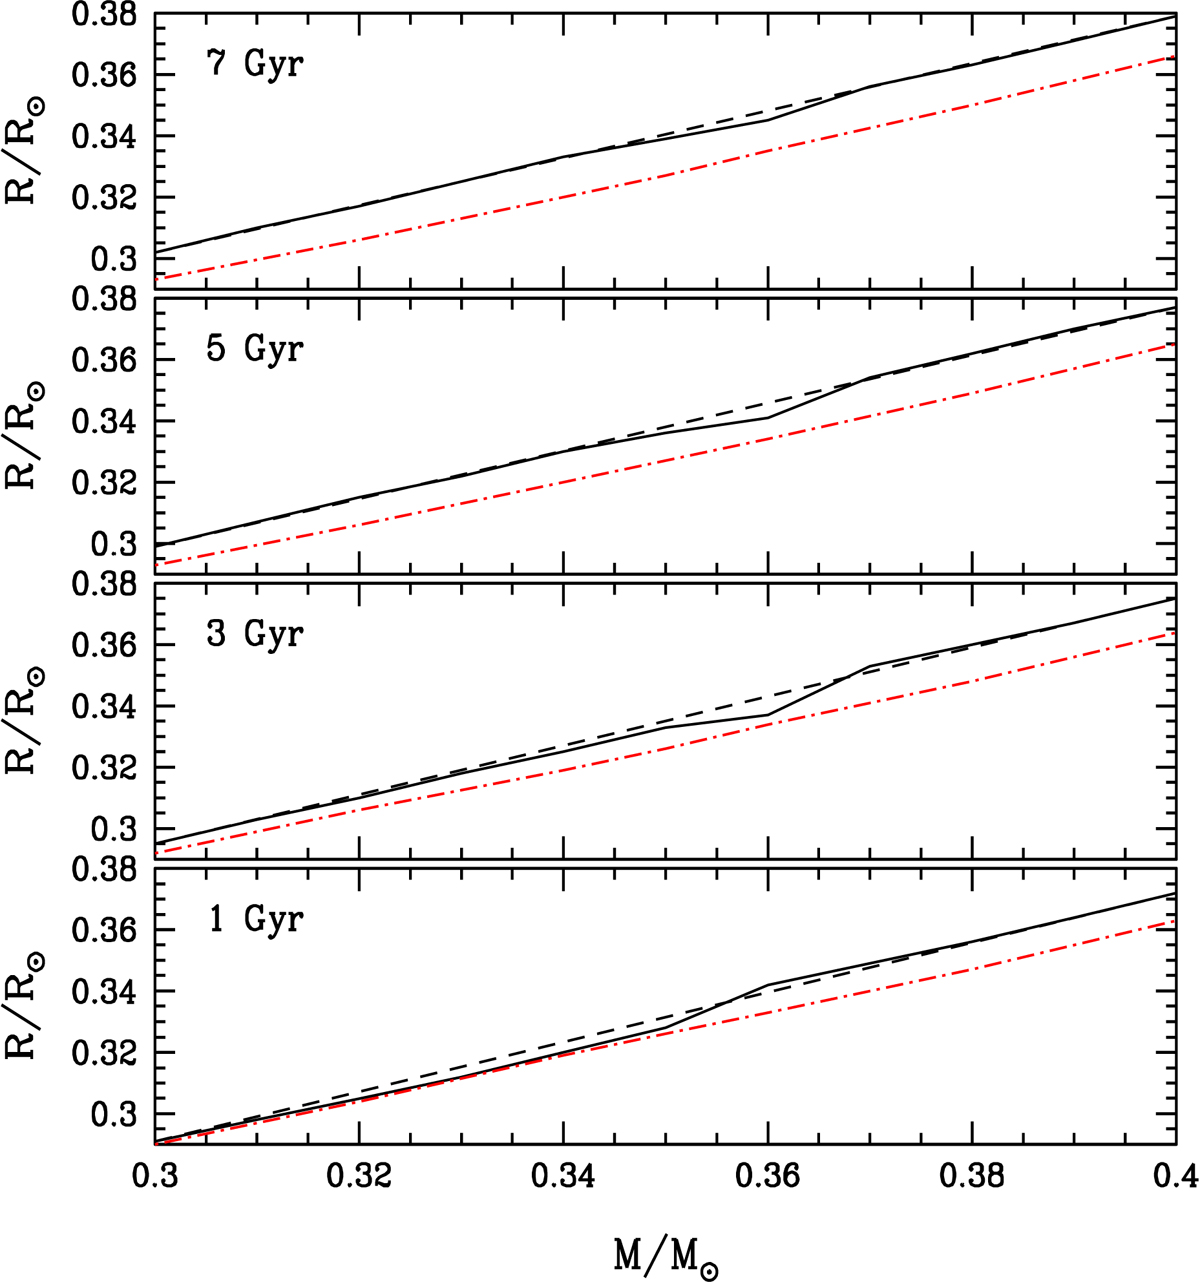
Mass-radius relationships at different ages in the fully to partly convective transition region (solid line). We note that the mass grid uses a spacing of 0.01 M⊙. To highlight changes in the slope, the dashed curve is a straight line connecting values of the radius between 0.3 M⊙ and 0.4 M⊙. The dash-dotted (red) curves correspond to the test case where 3He is forced to reach equilibrium (see Sect. 2.2).
Current usage metrics show cumulative count of Article Views (full-text article views including HTML views, PDF and ePub downloads, according to the available data) and Abstracts Views on Vision4Press platform.
Data correspond to usage on the plateform after 2015. The current usage metrics is available 48-96 hours after online publication and is updated daily on week days.
Initial download of the metrics may take a while.