Fig. 5
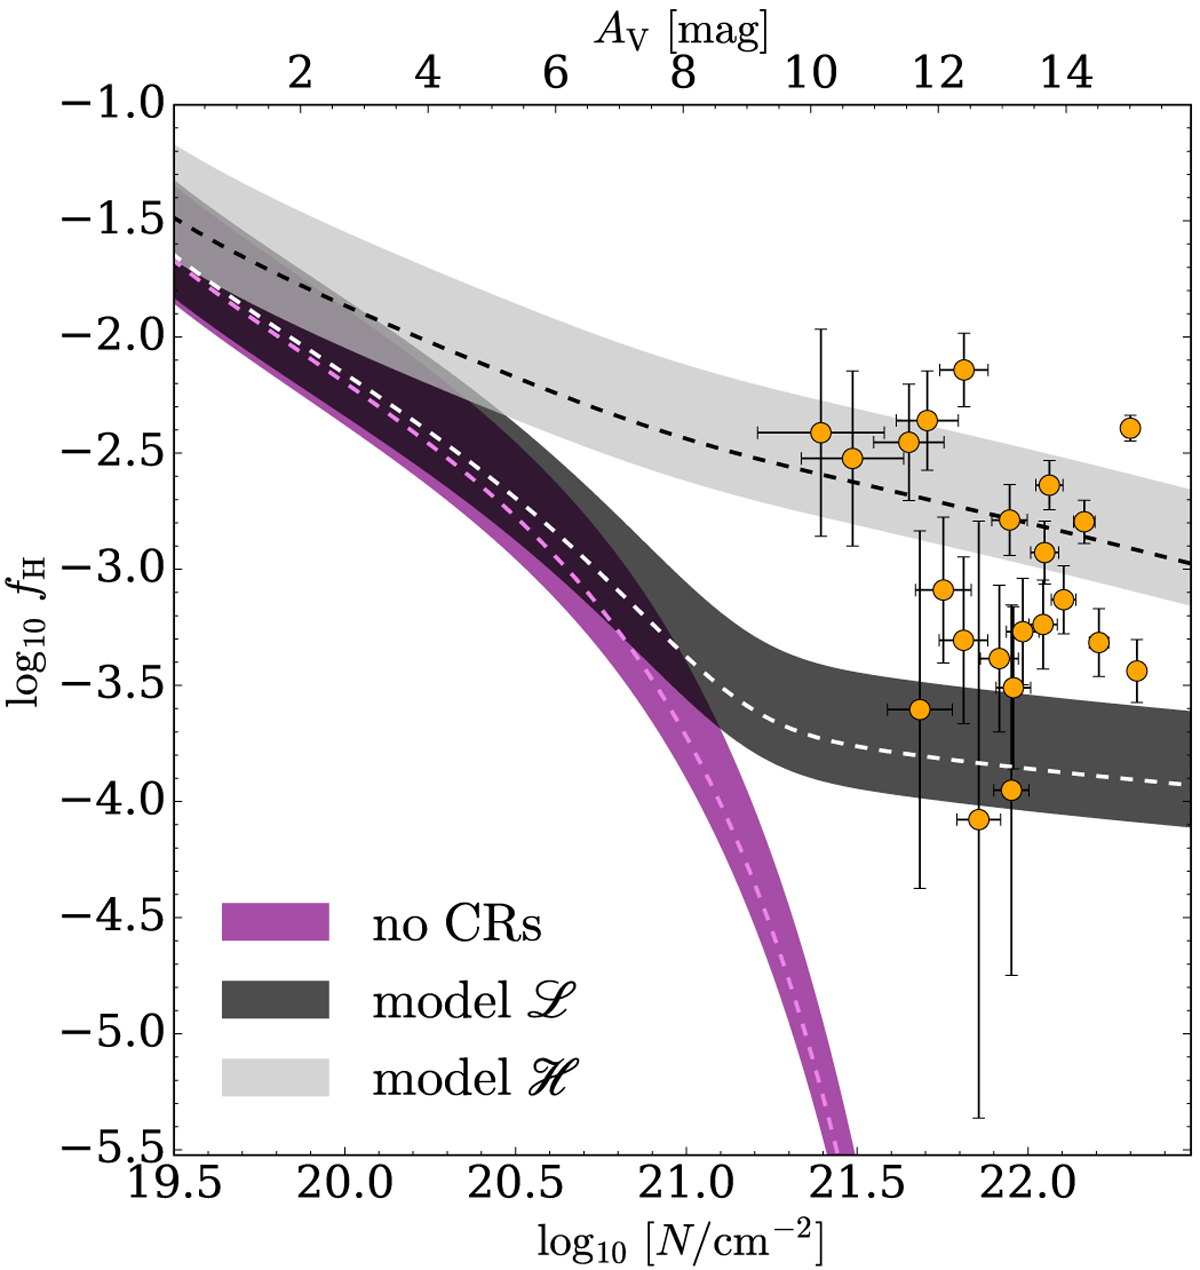
Atomic hydrogen fraction vs. the total column density of hydrogen (bottom scale) and visual extinction (top scale). Observations from Li & Goldsmith (2003) are shown as solid orange circles. Coloured stripes represent our results for the case of photodissociation only (purple), and models ![]() (black) and
(black) and ![]() (grey). Dashed lines refer to the average value of the total volume density of hydrogen (suggested by Li & Goldsmith 2003).
(grey). Dashed lines refer to the average value of the total volume density of hydrogen (suggested by Li & Goldsmith 2003).
Current usage metrics show cumulative count of Article Views (full-text article views including HTML views, PDF and ePub downloads, according to the available data) and Abstracts Views on Vision4Press platform.
Data correspond to usage on the plateform after 2015. The current usage metrics is available 48-96 hours after online publication and is updated daily on week days.
Initial download of the metrics may take a while.