Fig. 6.
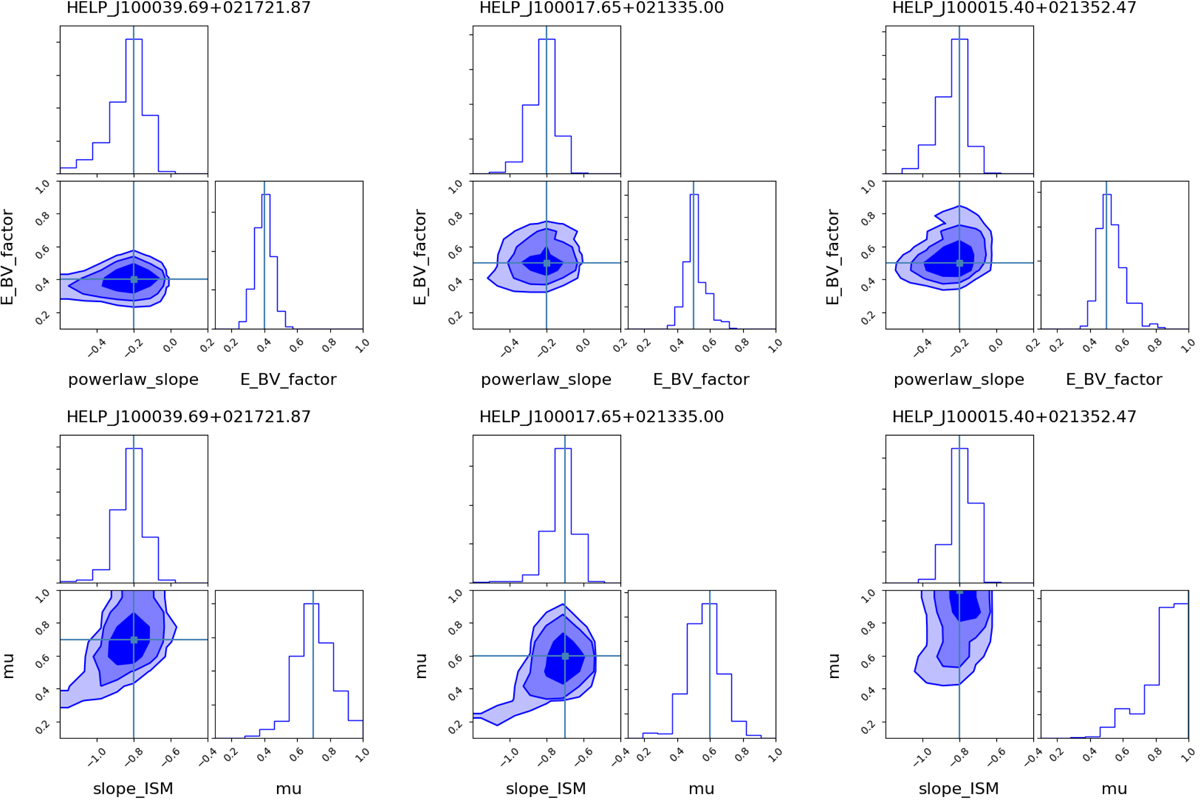
Likelihood distributions for three mock datasets between the two intrinsic parameters describing the flexible dust attenuation recipes (see text). The 2D and 1D likelihood distributions are represented in each panel for the Calzetti-like recipe (upper panels, parameters δ (x axis, powerlaw_slope) and E(B − V)star/E(B − V)line (y axis, E_BV_factor)) and for the DBPL-free recipe (lower panels, parameters n ISM (x axis, slope_ISM) and μ (y axis, mu)). The contour plots correspond to 68, 95 and 99% of the 2D likelihood distributions. The redshifts of the three selected sources are chosen to be representative of the whole sample: from left to right z = 0.7, 1 and 1.3. The blue vertical and horizontal lines represent the true input values. The labels on the plots are the output parameter names defined in CIGALE.
Current usage metrics show cumulative count of Article Views (full-text article views including HTML views, PDF and ePub downloads, according to the available data) and Abstracts Views on Vision4Press platform.
Data correspond to usage on the plateform after 2015. The current usage metrics is available 48-96 hours after online publication and is updated daily on week days.
Initial download of the metrics may take a while.