Free Access
Fig. 3.
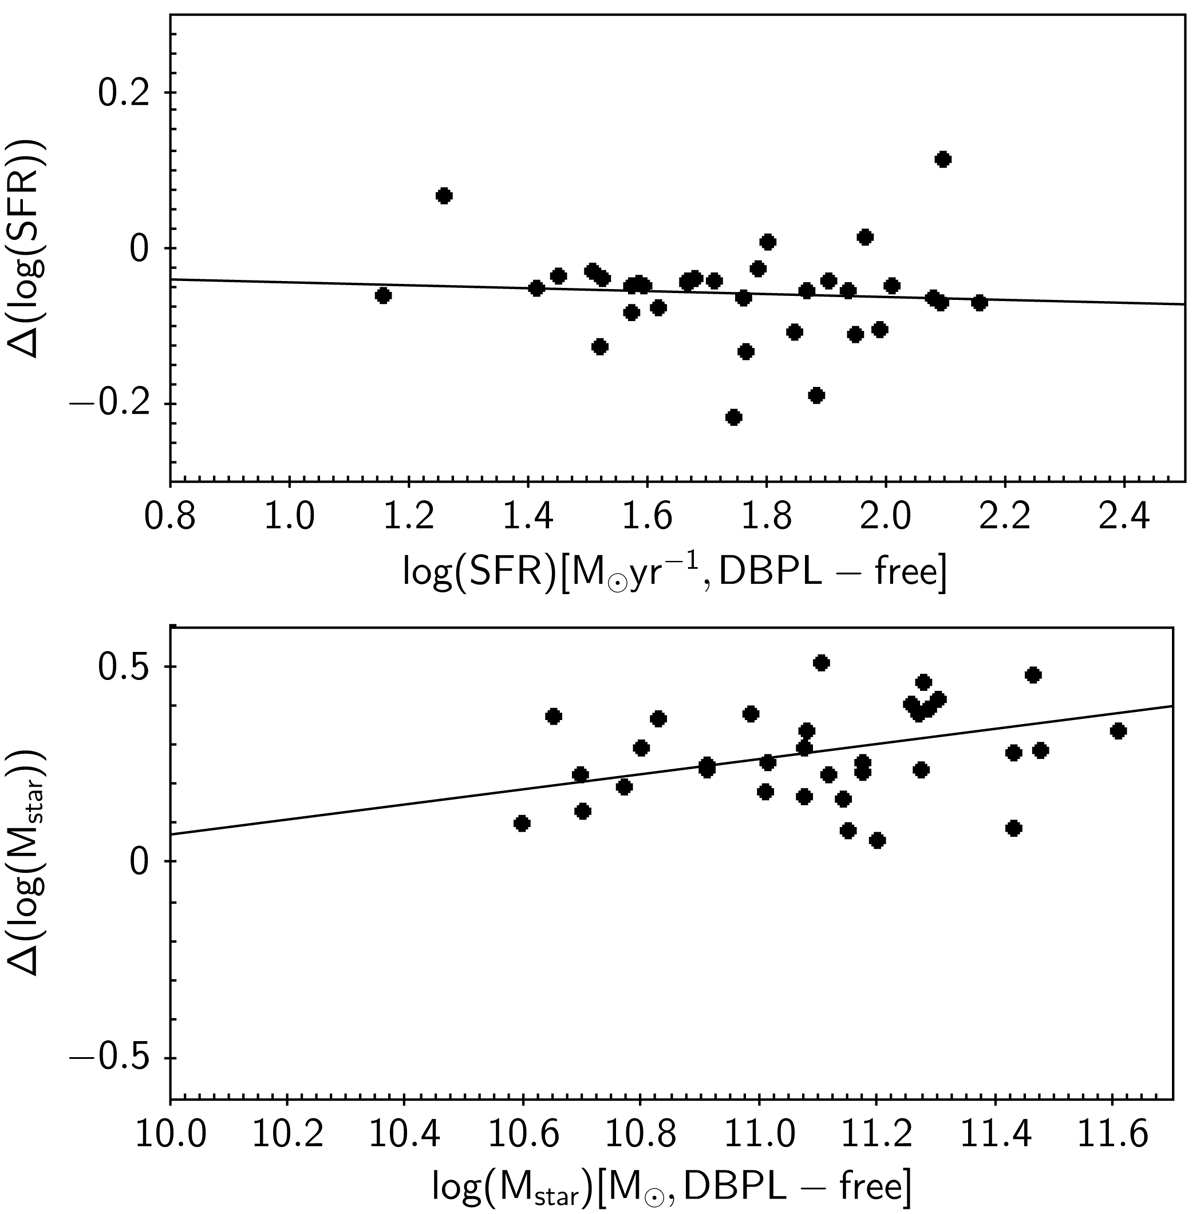
Comparison of SFR and Mstar for the two flexible recipes. The values along the x axis are obtained with the DBPL-free model, the difference between the DBPL-free and Calzetti-like models is plotted on the y axis (DBPL-free minus Calzetti-like logarithmic values). The solid lines are the result of a linear regression.
Current usage metrics show cumulative count of Article Views (full-text article views including HTML views, PDF and ePub downloads, according to the available data) and Abstracts Views on Vision4Press platform.
Data correspond to usage on the plateform after 2015. The current usage metrics is available 48-96 hours after online publication and is updated daily on week days.
Initial download of the metrics may take a while.