Fig. 12.
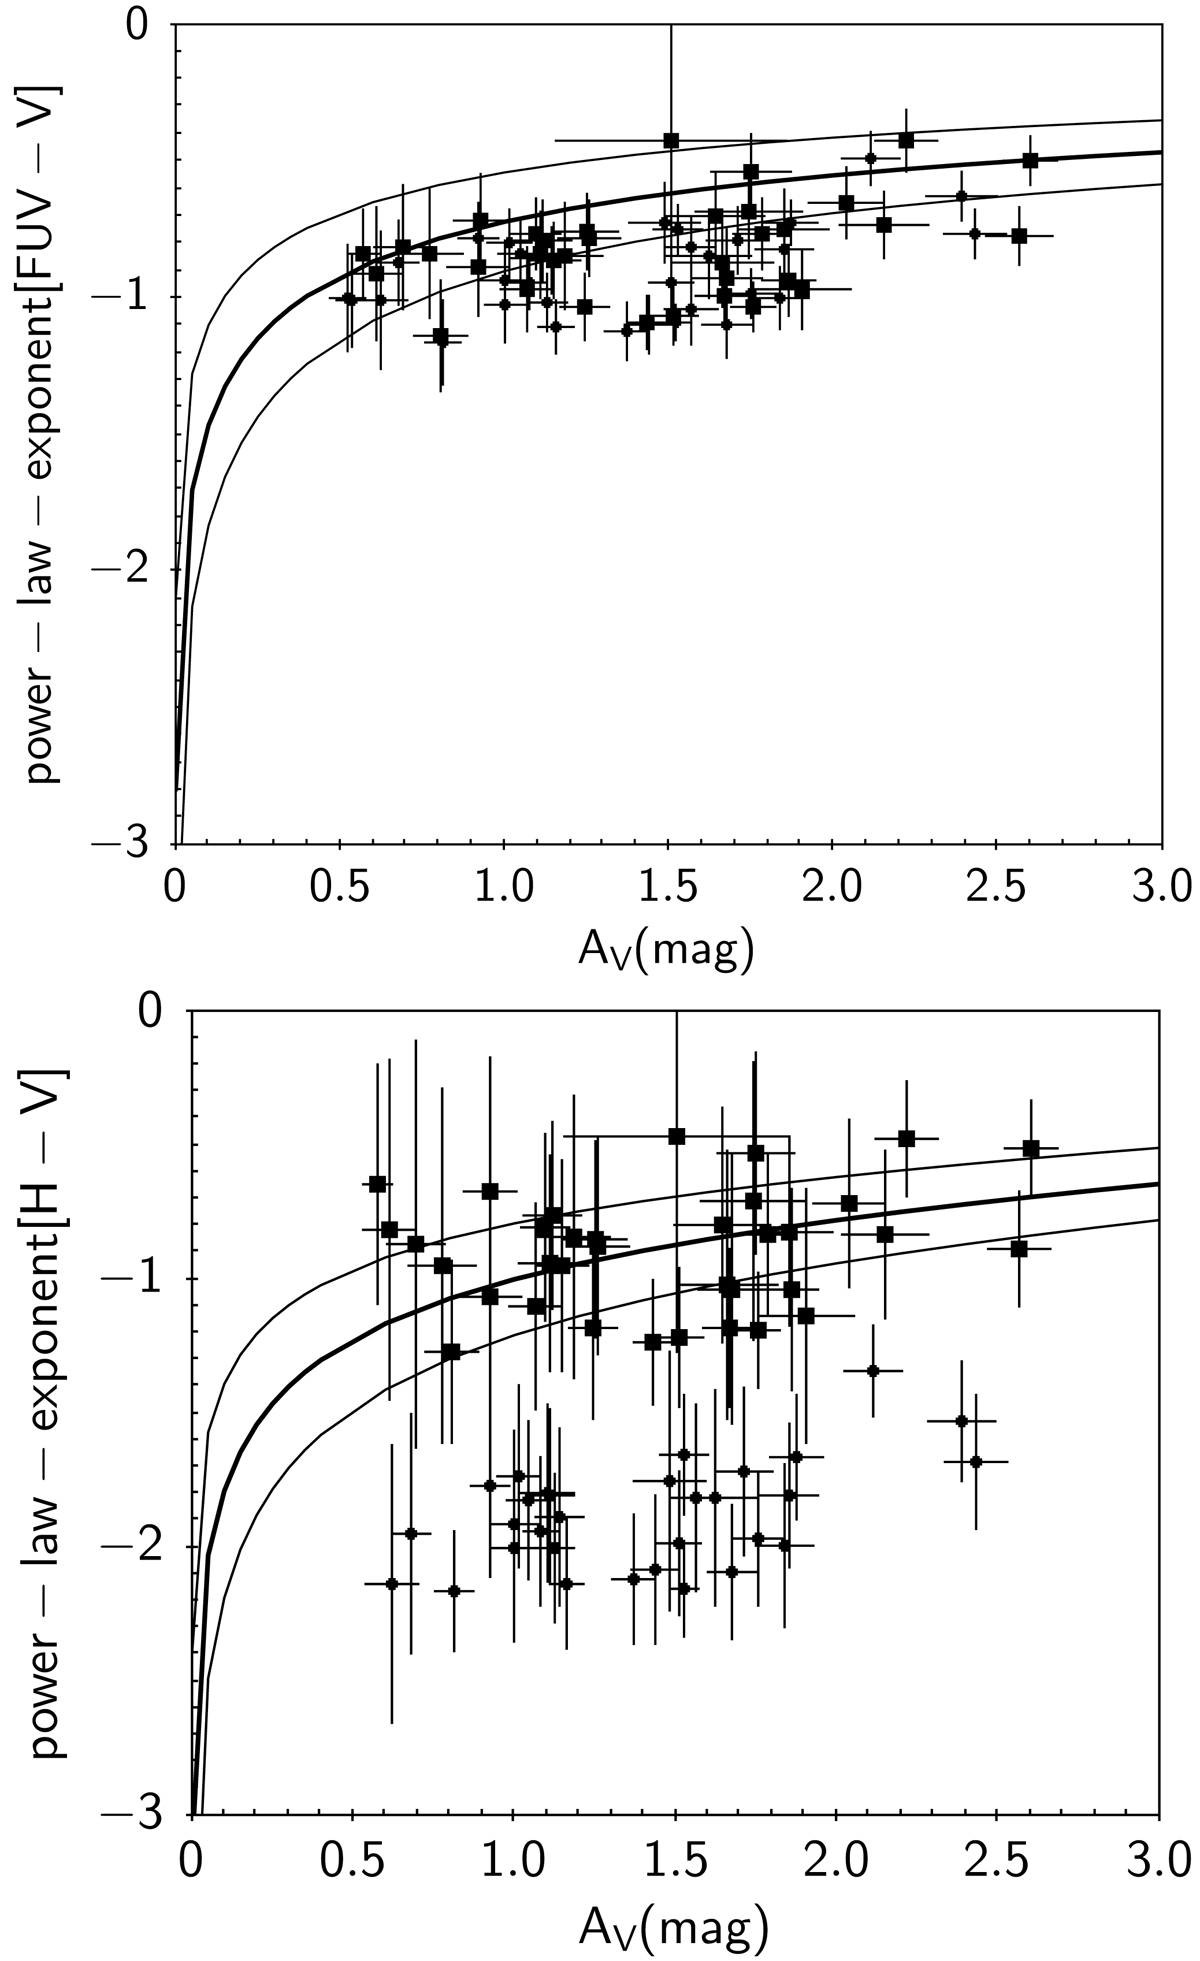
Power-law exponents of the effective attenuation laws measured in the visible (upper panel) and NIR (lower panel) are plotted against the attenuation in the V band, AV . and compared to the mean relations of Chevallard et al. (2013) plotted with a thick line, the thin lines corresponding to the 1σ uncertainty. The values obtained with the DBPL-free and the Calzetti-like modeling are plotted with filled squares and dots respectively. The one σ uncertainties are reported for each quantity.
Current usage metrics show cumulative count of Article Views (full-text article views including HTML views, PDF and ePub downloads, according to the available data) and Abstracts Views on Vision4Press platform.
Data correspond to usage on the plateform after 2015. The current usage metrics is available 48-96 hours after online publication and is updated daily on week days.
Initial download of the metrics may take a while.