Fig. 10.
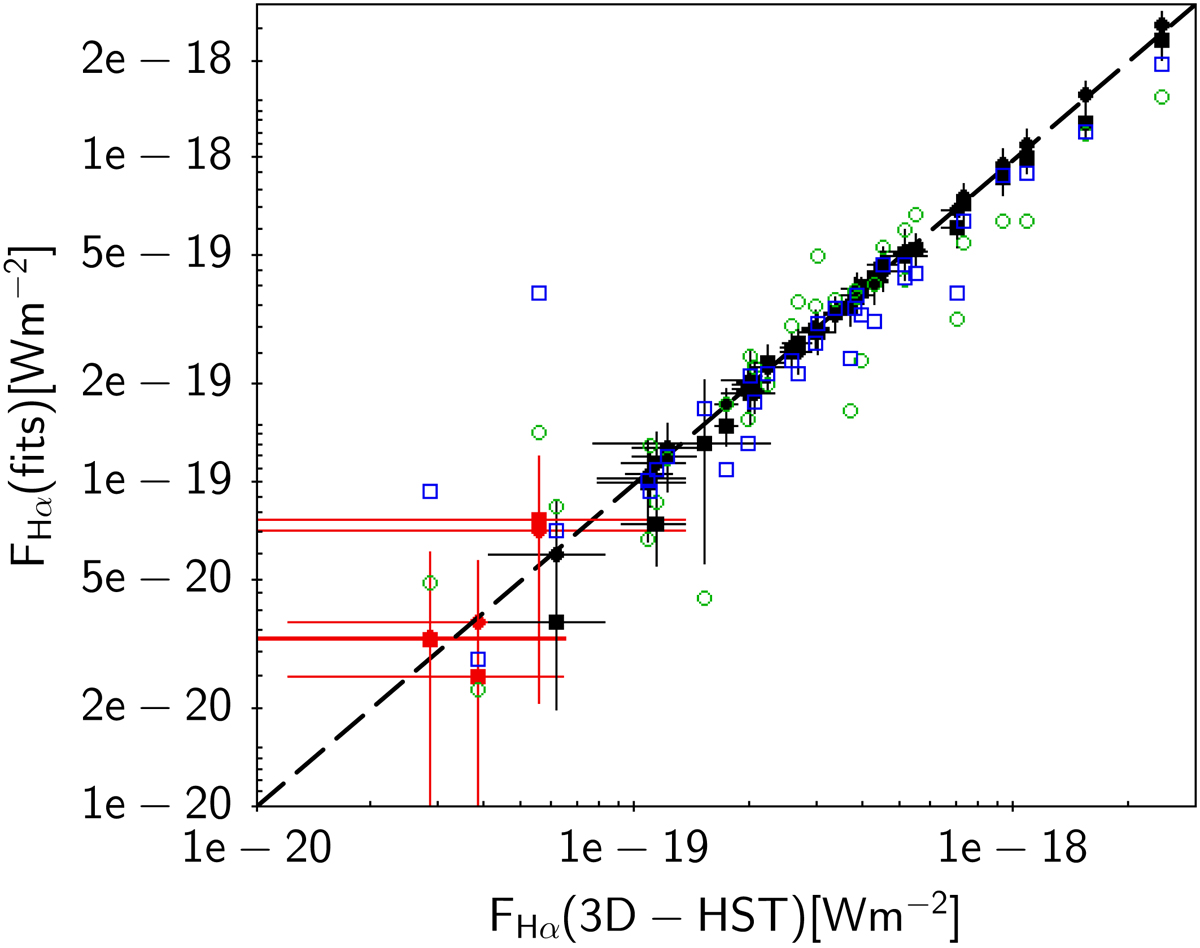
Comparison of observed 3D-HST Hα fluxes (x axis) with Hα fluxes estimated from the fits (y axis). The 4 attenuation recipes are considered: DBPL-free (filled squares), Calzetti-like (filled circles), CF00 (blue empty squares), C00 (green empty circles). The sources detected in Hα with a signal to noise ratio lower than 2 are represented in red with the same symbols as mentioned before. The dashed line is the 1:1 relation. The 1σ uncertainty on both measurements (observation and fit) is reported for only two flexible recipes (DPBL-free and Calzetti-like) to make the plot more clear.
Current usage metrics show cumulative count of Article Views (full-text article views including HTML views, PDF and ePub downloads, according to the available data) and Abstracts Views on Vision4Press platform.
Data correspond to usage on the plateform after 2015. The current usage metrics is available 48-96 hours after online publication and is updated daily on week days.
Initial download of the metrics may take a while.