Fig. 1.
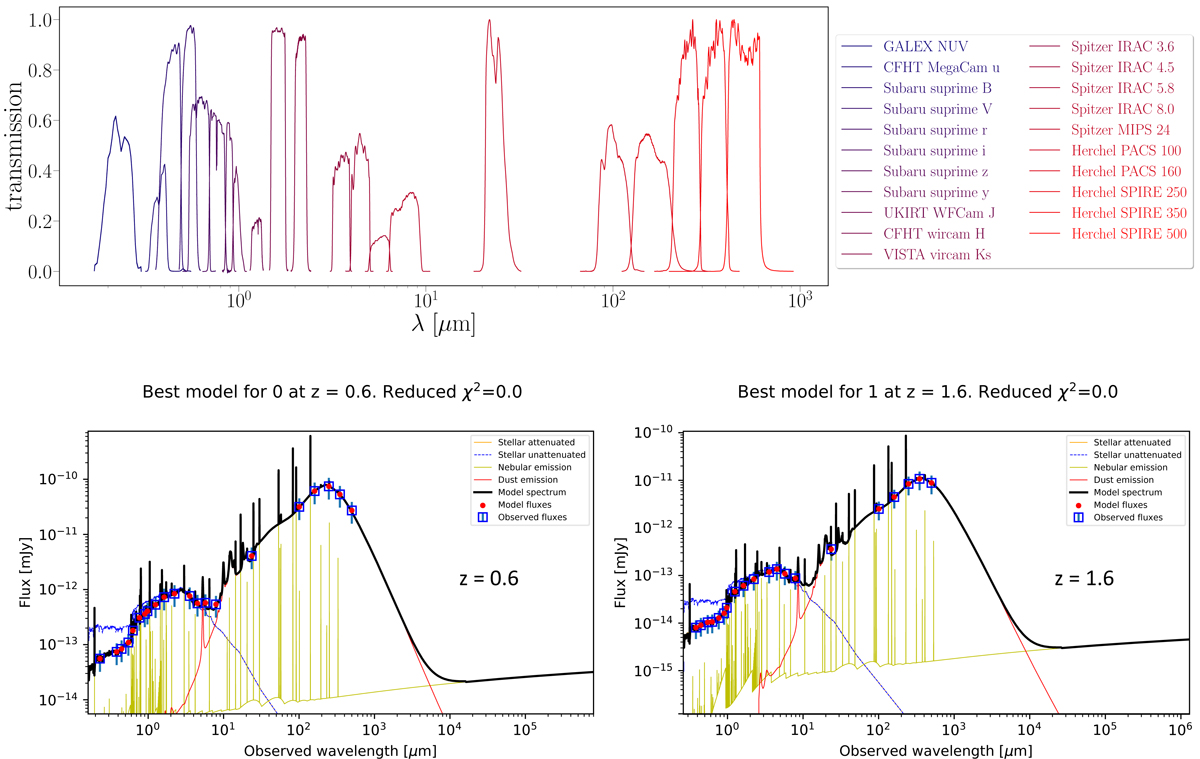
Upper panel: transmission curves of the filters used to build the SED of galaxies, the list of the filters is on the right side of the figure. Lower panel: template SED generated with CIGALE at z = 0.6 and z = 1.6. The solid line is the SED computed with the same modules as the ones used for the fits, with a single model of star formation, dust attenuation and reemission. The red points are the values of the fluxes in the filters whose transmission curves are plotted in the upper panel, the blue squares are mock observations generated by the code with an error of 10% (blue vertical lines, at 3σ). The fluxes are calculated for a total star formation of one solar mass (standard mode for the generation of models with CIGALE).
Current usage metrics show cumulative count of Article Views (full-text article views including HTML views, PDF and ePub downloads, according to the available data) and Abstracts Views on Vision4Press platform.
Data correspond to usage on the plateform after 2015. The current usage metrics is available 48-96 hours after online publication and is updated daily on week days.
Initial download of the metrics may take a while.