| Issue |
A&A
Volume 619, November 2018
|
|
|---|---|---|
| Article Number | A67 | |
| Number of page(s) | 7 | |
| Section | Atomic, molecular, and nuclear data | |
| DOI | https://doi.org/10.1051/0004-6361/201833773 | |
| Published online | 08 November 2018 | |
Laboratory rotational spectrum and astronomical search for methoxyacetaldehyde⋆
1
Grupo de Espectroscopia Molecular (GEM), Edificio Quifima, Área de Química-Física, Laboratorios de Espectroscopia y Bioespectroscopia, Parque Científico UVa, Unidad Asociada CSIC, Universidad de Valladolid, 47011 Valladolid, Spain
e-mail This email address is being protected from spambots. You need JavaScript enabled to view it.
2
Observatorio Astronómico Nacional (OAN-IGN), Calle Alfonso XII 3, 28014 Madrid, Spain
3
Instituto de Física Fundamental (IFF-CSIC), Calle Serrano 123, 28006 Madrid, Spain
Received:
4
July
2018
Accepted:
14
August
2018
Abstract
Context. Methoxyacetaldehyde belongs to a group of structural isomers with the general formula C3H6O2, of which methyl acetate and ethyl formate are known interstellar molecules. Rotational data available for methoxyacetaldehyde are limited to 40 GHz, which makes predictions at higher frequencies rather uncertain.
Aims. The aim of this work is to provide accurate experimental frequencies of methoxyacetaldehyde in the millimeter-wave region to support its detection in the interstellar medium.
Methods. The rotational spectrum of methoxyacetaldehyde was recorded at room-temperature from 75 to 120 GHz and from 170 to 310 GHz using the millimeter-wave spectrometer in Valladolid. Additional measurements were also performed at conditions of supersonic expansion from 6 to 18 GHz. The assigned rotational transitions were analyzed using the S -reduced semirigid-rotor Hamiltonian.
Results. We newly assigned over 1000 lines for the most stable conformer of methoxyacetaldehyde in its ground state and five lowest excited vibrational states, and precise sets of spectroscopic constants were obtained. We searched for spectral features of methoxyacetaldehyde in the high-mass star-forming regions Orion KL and Sagittarius B2, as well as in the cold dark cloud Barnard 1 (B1-b). No lines belonging to methoxyacetaldehyde were detected above the detection limit of our data. We provide upper limits to the methoxyacetaldehyde colum density in these sources.
Key words: astrochemistry / ISM: molecules / line: identification / astronomical databases: miscellaneous
Table 4 is only available at the CDS via anonymous ftp to cdsarc.u-strasbg.fr (130.79.128.5) or via http://cdsarc.u-strasbg.fr/viz-bin/qcat?J/A+A/619/A67
© ESO 2018
1. Introduction
Of all detected interstellar molecules, many have been observed in their isomeric counterparts, which indicates that isomerism plays an important role in interstellar chemistry (Hollis 2005). Numerous examples can be found in the molecule families with the general formula CxHyOz, which are the target of both experimental and theoretical works (see, e.g., Lovas et al. 2010; Karton & Talbi 2014; Rawlings et al. 2014; Abplanalp et al. 2015). A detailed laboratory analysis and extensive astronomical search for CxHyOz isomers bring valuable information about the chemical and physical processes occurring in the interstellar medium (ISM) as shown through the detection of two C3H2O isomers toward various starless cores and molecular clouds (Loison et al. 2016; Loomis et al. 2015).
The C3H6O2 isomers, among others, are good candidates for detection by microwave- and millimeter-wave spectroscopy because the dipole moments of individual members are rather large (Karton & Talbi 2014). Propanoic acid (CH3CH2COOH), the most energetically stable isomer of the C3H6O2 family, has not yet been detected, but it is a plausible species in regions where acetic acid is found (Blagojevic et al. 2003). Methyl acetate (CH3COOCH3) has been detected in Orion KL (Tercero et al. 2013) and is considered to be the most abundant non-cyclic isomer of C3H6O2. Detection of the anti conformer of ethyl formate (CH3CH2OCOH) toward Sgr B2(N) (Belloche et al. 2009, 2013) as well as the discovery of its gauche conformer in Orion KL (Tercero et al. 2013) means that other members in the C3H6O2 family, such as methoxyacetaldehyde, may also be ISM molecules. The upper limit to the column density 2 × 10⁻¹⁴ cm−1 in Orion KL for methoxyacetaldehyde was derived by Tercero et al. (2013) on the basis of predictions using Stark spectroscopy data below 40 GHz (Hirono et al. 1987) for the most stable trans-form. The authors noted, however, that the frequency predictions above 40 GHz were rather uncertain and that more laboratory data were needed for methoxyacetaldehyde in order to draw further conclusions on its contribution to the ice mantle and gas-phase chemistry of hot cores (Tercero et al. 2013).
The lack of accurate transition frequencies of methoxyacetaldehyde prompted new laboratory measurements in the frequency regions 75–120 and 170–310 GHz using frequencymodulation millimeter-wave spectroscopy. In addition, new microwave measurements between 6 and 18 GHz were also performed by chirped pulse Fourier transform microwave (CPFTMW) spectroscopy. A significantly refined set of rotational and centrifugal distortion constants is provided for the groundvibrational state of the most stable trans-form of methoxyacetaldehyde from the fit of over 400 transitions up to J = 70 and Ka = 14. Spectroscopic constants are also determined for the first five excited vibrational states. The results provided in this work were used to search for methoxyacetaldehyde in the ISM.
2. Experiments
The sample of liquid methoxyacetaldehyde (b.p. 92° C, Brader & Johnson 1969) was obtained commercially and was initially used without any purification. The vapor pressure of the sample was sufficient to fill the free-space cell of the spectrometer up to a pressure of about 25 μbar and to record the room-temperature spectra in the frequency ranges of 75–120 and 170−310 GHz. The millimeter-wave spectrometer we used has been described in Daly et al. (2014). It is based on cascaded multiplication of the basic synthesizer frequency (up to 20 GHz) by a set of active and passive multipliers. In this case, we applied the amplifier-multiplier chain WR9.0 (VDI, Inc.) alone or in combination with additional frequency doubler and tripler (WR4.3, WR2.8,VDI, Inc.). The synthesizer output was frequency modulated at f = 10.2 kHz with a modulation depth of between 30 and 40 kHz. A detection system consisting of either Schottky diodes or a broadband quasioptical detector (VDI, Inc.) was completed by a 2 f demodulation using a phase-sensitive lock-in amplifier.
The jet-cooled rotational spectrum was investigated using a broadband CP-FTMW spectrometer working in the frequency range 6–18 GHz (Mata et al. 2012). The sample was loaded into the reservoirs of two pulsed nozzles and was expanded into the vacuum chamber of the spectrometer using neon carrier gas at the pressure of 2 bar. Up to 165 000 individual free-induction decays (FIDs; four FIDs on each valve cycle) were averaged in the time domain and Fourier transformed using a Kaiser-Bessel window function to obtain the frequency-domain spectrum.
Initial scans in the millimeter-wave region immediately showed strong lines of methanol, water, and other unknown species, while the spectral features of methoxyacetaldehyde were poorly observed. Although significant efforts have been made to purify the sample, strong lines of these contaminating species remain in the spectrum. The difficulties associated with the purity of methoxyacetaldehyde probably arise from its instability (Wehlan et al. 2015) and the capability to form azeotropic mixtures with water and methanol (Brader & Johnson 1969).
3. Rotational spectra and analysis
Several rotameric forms are possible for methoxyacetaldehyde, but only the trans-form, defined by two dihedral angles ø1(C–O– C–C) = 180° and ø2(O–C–C=O) = 180° (see Fig. 1a), was analyzed in previous microwave work (Hirono et al. 1987). This is an asymmetric top molecule with a highly prolate character (κ = −0.99) and dipole-moment components of |μa| = 2.87 D, |μb| = 0.53 D, and |μc| = 0.0 D (Hirono et al. 1987). Regularly spaced groups of a-type R-branch transitions were easily identified. A preliminary least-squares fit of the a-type transitions allowed predictions of the b-type ones. These transitions were not observed in the previous microwave study of Hirono et al. (1987). Three b-type P-branch transitions were finally localized in the jet-cooled spectrum. In addition, these transitions were found as doublets situated closely around the rigid rotor pattern (see 212 ← 303 transition in Fig. 1a). This doublet structure was attributed to the internal rotation of the methyl group and was fit using the XIAM program (Hartwig & Dreizler 1996) to obtain the barrier to internal rotation V3. The results of the fit are given in Table 1. In order to refine the determination of the A rotational constant, the unperturbed frequencies of the splitted transitions were calculated as ν = (νA + 2 νE)/3 (Gordy & Cook 1984) and were fit together with unsplit a-type R-branch transitions.
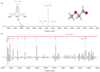 |
Fig. 1. Panel a: section of the jet-cooled CP-FTMW spectrum of methoxyacetaldehyde with an assignment of a-type R-branch and b-type P-branch transitions. The A−E splitting due to the internal rotation of the methyl group is shown in the inset. Panel b: section of the millimeterwave spectrum of methoxyacetaldehyde, showing the central part of the J = 43 ← 42 rotational transition. |
A−E splitted transitions observed in the jet-cooled spectrum of methoxyacetaldehyde and the spectroscopic parameters obtained from their analysis.
This first analysis of the jet-cooled CP-FTMW spectrum was fundamental for the search of the millimeter-wave transitions of methoxyacetaldehyde among the lines of contaminating species. While many a-type R-branch transitions could be identified in the millimeter-wave spectra (a portion of the spectrum is shown in Fig. 1b), no b-type transitions were found, probably because they are weak and because of the problems associated with the purity of the sample. No c-type transitions were observed, which is in accordance with the Cs symmetry of the molecule. Finally, the rotational transitions reported in previous microwave study (Hirono et al. 1987) were also included in the analysis, even though larger deviations (up to 280 kHz) were found between their observed and calculated frequencies. The lower quality of data from Hirono et al. (1987) is evident from the poorly modulated Stark records and from a direct comparison of the lines in common with those measured with the CP-FTMW technique in this work (compare, e.g., the 313 ← 212 transition of 13288.75 MHz measured in Hirono et al. (1987) and the 13288.54 MHz measured here). All the measured rotational transitions were globally fit to Watson’s S -reduced semi-rigid Hamiltonian (Watson et al. 1977) with centrifugal distortion terms up to sixth order. The fitted set of rotational and centrifugal distortion constants is provided in Table 2. The list of experimental frequencies is given in Table 4.
Spectroscopic constants of methoxyacetaldehyde in the ground state and five excited vibrational states (S -reduction, Ir-representation).
In addition to the ground-state lines, groups of slightly weaker satellite lines, presumably belonging to excited vibrational states of the trans-rotamer, were observed in the millimeter-wave spectrum. For the vibrational assignment of these satellite lines, we calculated the harmonic frequencies and vibration-rotation contributions to the rotational constants at the MP2/6-311++G(d,p) level of the theory (Gaussian16 package, Frisch et al. 2016). According to the calculations, the two lowest-frequency modes are ν27 and ν26 with predicted harmonic frequencies of 50 and 84 cm−1, respectively, related with aldehyde and O–C torsion. The first two excited states ν27 = 1 and ν26 = 1 could be easily identified by the comparison of values of their experimental changes in rotational constants relative to the ground state with their calculated counterparts (see Table A.1). Subsequently, we localized their second excited states ν27 = 2 and ν26 = 2 as well as a combination state (ν27 = 1, ν26 = 1) on the basis of linear additivity of changes in rotational constants on vibrational excitation (see Table A.2). Spectroscopic constants for all these states resulting from the fit to the Watson S -reduced semi-rigid Hamiltonian are collected in Table 2.
The comparison of the spectroscopic constants for the excited vibrational states with those for the ground state in Table 2 points to interactions between excited vibrational states that are close in energy. Harmonic vibrational energies of 50, 84, 100, 134, and 168 cm−1 are predicted for the ν27 = 1, ν26 = 1, ν27 = 2, (ν27 = 1, ν26 = 1), and ν26 = 2 states, respectively. Practically all these excited states might be involved in complex interstate interactions, which are reflected in the anomalous values of the centrifugal distortion constants.
4. Radioastronomical observations
The improved frequency predictions we provide here enabled us to carry out a rigorous search for methoxyacetaldehyde in space. We focused on the two most frequently studied high-mass starforming regions, Orion KL and Sagittarius (Sgr) B2 because other C3H6O2 isomers are also present in these regions (see Sect. 1). In addition, complex aldehydes such as CH2OHCHO and CH3CH2CHO have been detected toward the envelope of Sgr B2 (Hollis et al. 2002, 2004). Nonetheless, because the methoxy radical (CH3O) and acetaldehyde (CH3CHO) have largely been found in cold gas (Cernicharo et al. 2012; Kaifu et al. 2004; Matthews et al. 1985), we also searched for CH3OCH2CHO in Barnard 1-b, a low-mass star-forming region at the first evolutionary stages (see, e.g., Gerin et al. 2015). We used the MADEX code (Cernicharo 2012) to exploit the spectroscopic parameters presented in this work and to derive the synthetic spectrum of this species (assuming local thermodynamic equilibrium) according to the physical parameters of the source (see below) collected in Table 3. We restricted the search to a-type transitions with uncertainties of the predicted frequencies below 10 kHz. The column density was the only free parameter for these models. Corrections for beam dilution were applied to each line depending on their frequency.
Physical parameters of the considered cloud cores.
Orion KL. Data from the ALMA interferometer (ALMA Science Verification, SV, 213.7−246.7 GHz; see, e.g., Tercero et al. 2015) were explored to search for CH3OCH2CHO. Based on the spatial distribution found by Tercero et al. (2015) for ethyl formate (CH3CH2OCOH) in this source, we focused the search on the spectrum toward the compact ridge position (location of the emission peak of this species). The emission peaks of methyl formate (CH3OCOH, Favre et al. 2011), dimethyl ether (CH3OCH3, Brouillet et al. 2013), and ethyl methyl ether (CH3CH2OCH3, Tercero et al. 2015) are also located at this position. To model the CH3OCH2CHO emission, we adopted the physical parameters derived by Tercero et al. (2015) for ethyl formate. We did not find CH3OCH2CHO above the detection limit of the data. Figure 2 shows selected frequencies of these data together with the model derived by MADEX that demonstrates the lack of CH3OCH2CHO lines. The upper limit to the CH3OCH2CHO column density in the compact ridge of Orion is shown in Table 3.
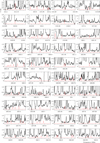 |
Fig. 2. Observed data of the compact ridge of Orion KL taken with the ALMA interferometer (histogram black spectrum) together with the synthetic spectra obtained using the column density given as upper limit in Table 3 (thin red curve). A υLSR of +7.5 km s−1 is assumed. |
Sgr B2. We also searched for CH3OCH2CHO in the public data of Sgr B2, that is, in IRAM 30 m data at 3 mm (Belloche et al. 2013) and in data of the PRIMOS survey1 (Neill et al. 2012). Whereas the IRAM data trace the emission from the hot cores of Sgr B2 more clearly, the PRIMOS data identify the coldest gas of the envelope. We did not find methoxyaldehyde above the detection limit of these data. To estimate an upper limit to the CH3OCH2CHO column density in the hot core of Sgr B2(N), we adopted the physical parameters derived by Belloche et al. (2013) for trans-CH3CH2OCOH (see Table 3). Figure 3 shows the model provided by MADEX (red line) together with the IRAM 30 m data of Sgr B2(N) (black histogram) and the total model of the source (green curve) provided by Belloche et al. (2013).
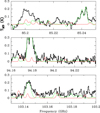 |
Fig. 3. Observed data of Sgr B2 taken with the IRAM 30 m telescope (histogram black spectrum) together with the synthetic spectra obtained using the column density given as upper limit in Table 3 (thin red curve). The synthetic total model for the 30 m data of Sgr B2(N) (see Belloche et al. 2013) is overlaid in green. A νLSR of +64.0 km s−1 is assumed. |
B1-b. To search for CH3OCH2OH in B1-b, we used IRAM 30 m data and the physical properties of the cloud presented in Cernicharo et al. (2012). Owing to the non-detection of this species, only upper limits to its column density can be derived (see Table 3).
Table 3 shows the CH3CH2OCOH/CH3OCH2CHO column density ratios in the compact ridge of Orion KL and Sgr B2(N). It is worth noting that the lower limit ratio derived for Orion coincides with that obtained by Tercero et al. (2013) using 30 m data and uncertain frequency predictions for methoxyacetaldehyde. Nonetheless, the accurate values for the predicted frequencies such as those provided in this work allow us to ensure the non-detection of this species in the selected data. The study of different isomers in the ISM provides a wide view of prevailing functional groups in space. The non-detection of methoxyacetaldehyde in either hot or cold gas implies an important constraint for determining the production of complex aldehydes. Whereas formates, acetates, cyanides, and ethers have been observed in molecules containing more than 11 atoms toward dense regions (Belloche et al. 2009, 2014; Tercero et al. 2013, 2015), the largest detected aldehyde in the ISM so far is propanal (CH3CH2CHO).
The 100 m Green Bank Telescope (GBT) PRebiotic Interstellar MOlecule Survey covers a frequency band between 7 and 50 GHz. Access to the entire PRIMOS data set, specifics on the observing strategy, and overall frequency coverage information is available at http://www.cv.nrao.edu/~aremijan/PRIMOS/
Acknowledgments
The research leading to these results has received funding from the European Research Council under the European Union’s Seventh Framework Programme (FP/2007-2013)/ERC-2013-SyG, Grant Agreement n. 610256 NANOCOSMOS, Ministerio de Ciencia e Innovación (Grants CTQ2013-40717-P, CTQ2016-76393-P, AYA2012-32032, and Consolider-Ingenio 2010 CSD2009-00038 program “ASTROMOL”) and Junta de Castilla y León (VA077U16). E.R.A. thanks Ministerio de Ciencia e Innovación for FPI grant (BES-2014-067776).
References
- Abplanalp, M. J., Borsuk, A., Jones, B. M., & Kaiser, R. I. 2015, ApJ, 814, 45 [NASA ADS] [CrossRef] [Google Scholar]
- Belloche, A., Garrod, R. T., Müller, H. S. P., et al. 2009, A&A, 499, 215 [NASA ADS] [CrossRef] [EDP Sciences] [Google Scholar]
- Belloche, A., Müller, H. S. P., Menten, K. M., Schilke, P., & Comito, C. 2013, A&A, 559, A47 [NASA ADS] [CrossRef] [EDP Sciences] [Google Scholar]
- Belloche, A., Garrod, R. T., Müller, H. S. P., & Menten, K. M. 2014, Science, 345, 1584 [NASA ADS] [CrossRef] [PubMed] [Google Scholar]
- Blagojevic, V., Petrie, S., & Bohme, D. K. 2003, MNRAS, 339, L7 [NASA ADS] [CrossRef] [Google Scholar]
- Brader, W., & Johnson, F. 1969, Method for the Purification of Methoxyacetaldehyde, US Patent 3, 481, 837 [Google Scholar]
- Brouillet, N., Despois, D., Baudry, A., et al. 2013, A&A, 550, A46 [NASA ADS] [CrossRef] [EDP Sciences] [Google Scholar]
- Cernicharo, J. 2012, ECLA-2011: Proceedings of the European Conference on Laboratory Astrophysics, Laboratory Astrophysics and Astrochemistry in the Herschel/ALMA Era, 58, 251 [Google Scholar]
- Cernicharo, J., Marcelino, N., Roueff, E., et al. 2012, ApJ, 759, L43 [NASA ADS] [CrossRef] [Google Scholar]
- Daly, A., Kolesniková, L., Mata, S., & Alonso, J. 2014, J. Mol. Spectr., 306, 11 [NASA ADS] [CrossRef] [Google Scholar]
- Favre, C., Wootten, H. A., Remijan, A. J., et al. 2011, ApJ, 739, L12 [NASA ADS] [CrossRef] [Google Scholar]
- Frisch, M. J., Trucks, G. W., & Schlegel, H. B. 2016, Gaussian16 Revision B.01 (Wallingford CT: Gaussian Inc). [Google Scholar]
- Gerin, M., Pety, J., Fuente, A., et al. 2015, A&A, 577, L2 [NASA ADS] [CrossRef] [EDP Sciences] [Google Scholar]
- Gordy, W., & Cook, R. L. 1984, Microwave Molecular Spectra (New York: Wiley Interscience) [Google Scholar]
- Hartwig, H., & Dreizler, H. 1996, Z. Naturforsch. A, 51, 923 [NASA ADS] [Google Scholar]
- Hirono, H., Shibano, J., Mitani, A., et al. 1987, J. Mol. Struct., 162, 359 [NASA ADS] [CrossRef] [Google Scholar]
- Hollis, J. M. 2005, Proc. Int. Astron. Union, 1, 227 [CrossRef] [Google Scholar]
- Hollis, J. M., Lovas, F. J., Jewell, P. R., & Coudert, L. H. 2002, ApJ, 571, L59 [NASA ADS] [CrossRef] [Google Scholar]
- Hollis, J. M., Jewell, P. R., Lovas, F. J., Remijan, A., & Møllendal, H. 2004, ApJ, 610, L21 [NASA ADS] [CrossRef] [Google Scholar]
- Kaifu, N., Ohishi, M., Kawaguchi, K., et al. 2004, PASJ, 56, 69 [NASA ADS] [CrossRef] [Google Scholar]
- Karton, A., & Talbi, D. 2014, Chem. Phys., 22, 436 [Google Scholar]
- Loison, J.-C., Agúndez, M., Marcelino, N., et al. 2016, MNRAS, 456, 4101 [Google Scholar]
- Loomis, R. A., McGuire, B. A., Shingledecker, C., et al. 2015, ApJ, 799, 34 [Google Scholar]
- Lovas, F., Plusquellic, D., Weaver, S. W., McGuire, B., & Blake, G. 2010, J. Mol. Spectr., 264, 10 [NASA ADS] [CrossRef] [Google Scholar]
- Mata, S., Pena, I., Cabezas, C., López, J., & Alonso, J. 2012, J. Mol. Spectr., 280, 91 [NASA ADS] [CrossRef] [Google Scholar]
- Matthews, H. E., Friberg, P., & Irvine, W. M. 1985, ApJ, 290, 609 [NASA ADS] [CrossRef] [PubMed] [Google Scholar]
- Neill, J. L., Muckle, M. T., Zaleski, D. P., et al. 2012, ApJ, 755, 153 [NASA ADS] [CrossRef] [Google Scholar]
- Rawlings, J. M. C., Williams, D. A., Viti, S., Cecchi-Pestellini, C., & Duley, W. W. 2014, Faraday Discuss., 168, 369 [NASA ADS] [CrossRef] [Google Scholar]
- Tercero, B., Kleiner, I., Cernicharo, J., et al. 2013, ApJ, 770, L13 [Google Scholar]
- Tercero, B., Cernicharo, J., López, A., et al. 2015, A&A, 582, L1 [NASA ADS] [CrossRef] [EDP Sciences] [Google Scholar]
- Watson, J. K. G. 1977, Vibrational Spectra and Structure, ed. J. R. Durig (Amsterdam: Elsevier), 6, 1 [Google Scholar]
- Wehlan, H., Oehme, J., Schäfer, A., & Rossen, K. 2015, Org. Process Res. Dev., 19, 1980 [CrossRef] [Google Scholar]
Appendix A: Additional tables
Vibrational changes in rotational constants for the first excited vibrational states in methoxyacetaldehyde.
Vibrational changes in rotational constants for the second and combination excited states in methoxyacetaldehyde.
All Tables
A−E splitted transitions observed in the jet-cooled spectrum of methoxyacetaldehyde and the spectroscopic parameters obtained from their analysis.
Spectroscopic constants of methoxyacetaldehyde in the ground state and five excited vibrational states (S -reduction, Ir-representation).
Vibrational changes in rotational constants for the first excited vibrational states in methoxyacetaldehyde.
Vibrational changes in rotational constants for the second and combination excited states in methoxyacetaldehyde.
All Figures
|
Fig. 1. Panel a: section of the jet-cooled CP-FTMW spectrum of methoxyacetaldehyde with an assignment of a-type R-branch and b-type P-branch transitions. The A−E splitting due to the internal rotation of the methyl group is shown in the inset. Panel b: section of the millimeterwave spectrum of methoxyacetaldehyde, showing the central part of the J = 43 ← 42 rotational transition. |
| In the text | |
|
Fig. 2. Observed data of the compact ridge of Orion KL taken with the ALMA interferometer (histogram black spectrum) together with the synthetic spectra obtained using the column density given as upper limit in Table 3 (thin red curve). A υLSR of +7.5 km s−1 is assumed. |
| In the text | |
|
Fig. 3. Observed data of Sgr B2 taken with the IRAM 30 m telescope (histogram black spectrum) together with the synthetic spectra obtained using the column density given as upper limit in Table 3 (thin red curve). The synthetic total model for the 30 m data of Sgr B2(N) (see Belloche et al. 2013) is overlaid in green. A νLSR of +64.0 km s−1 is assumed. |
| In the text | |
Current usage metrics show cumulative count of Article Views (full-text article views including HTML views, PDF and ePub downloads, according to the available data) and Abstracts Views on Vision4Press platform.
Data correspond to usage on the plateform after 2015. The current usage metrics is available 48-96 hours after online publication and is updated daily on week days.
Initial download of the metrics may take a while.