Fig. 3.
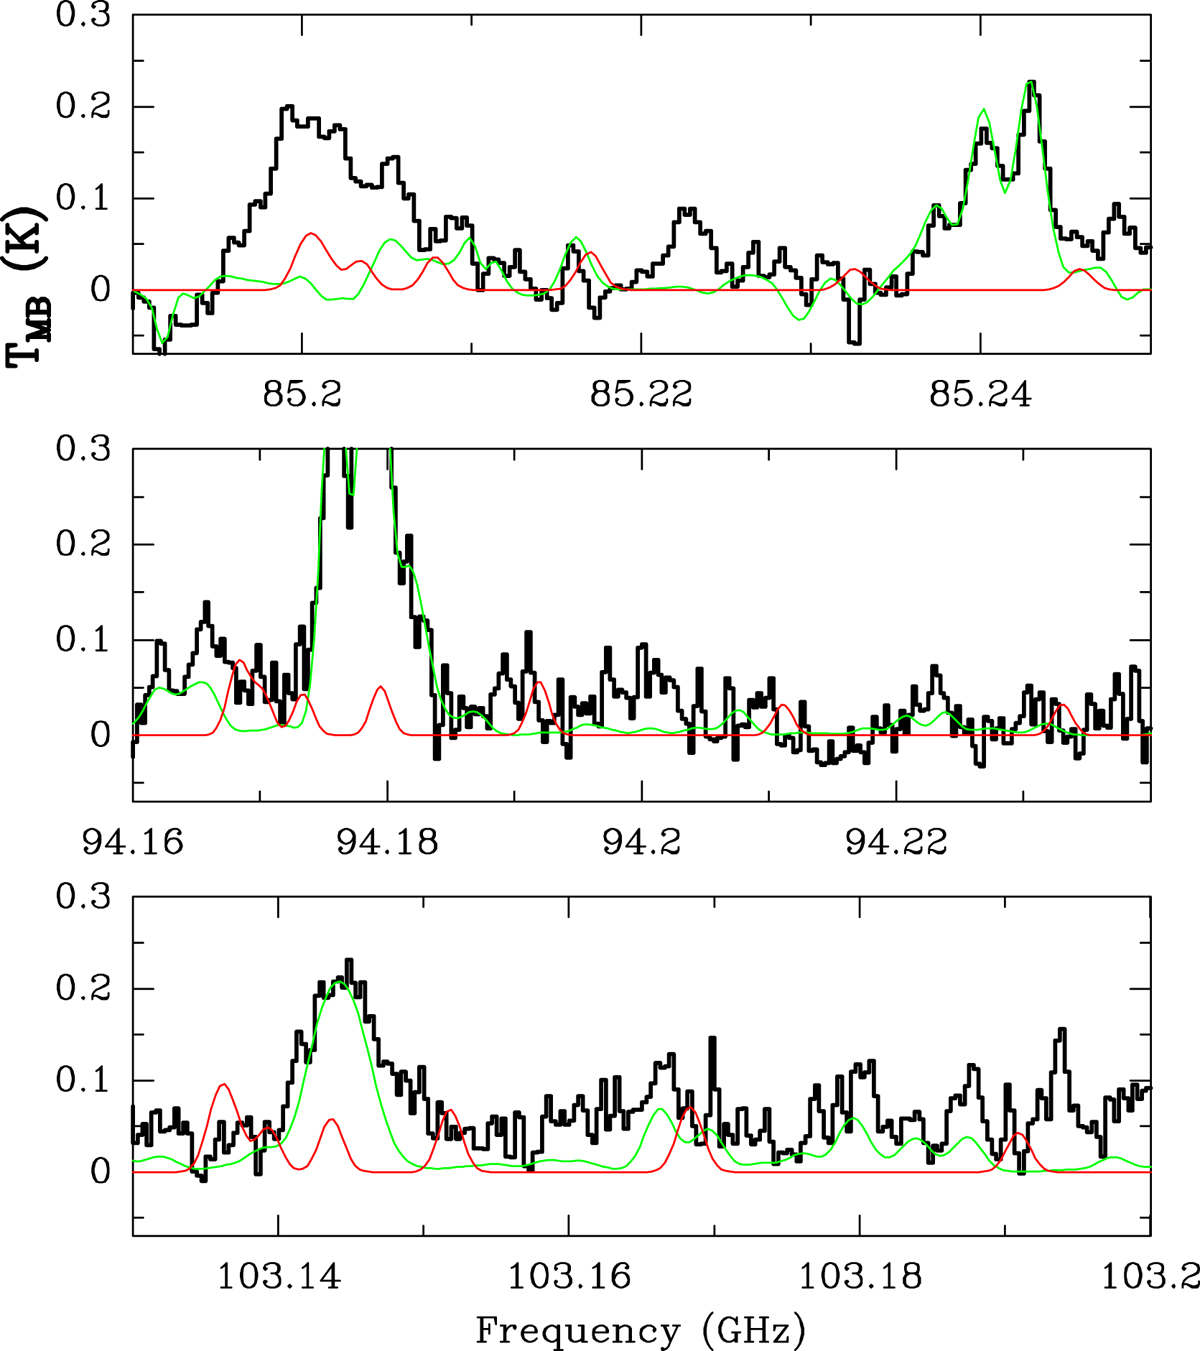
Observed data of Sgr B2 taken with the IRAM 30 m telescope (histogram black spectrum) together with the synthetic spectra obtained using the column density given as upper limit in Table 3 (thin red curve). The synthetic total model for the 30 m data of Sgr B2(N) (see Belloche et al. 2013) is overlaid in green. A νLSR of +64.0 km s−1 is assumed.
Current usage metrics show cumulative count of Article Views (full-text article views including HTML views, PDF and ePub downloads, according to the available data) and Abstracts Views on Vision4Press platform.
Data correspond to usage on the plateform after 2015. The current usage metrics is available 48-96 hours after online publication and is updated daily on week days.
Initial download of the metrics may take a while.