| Issue |
A&A
Volume 619, November 2018
|
|
|---|---|---|
| Article Number | A40 | |
| Number of page(s) | 6 | |
| Section | Stellar structure and evolution | |
| DOI | https://doi.org/10.1051/0004-6361/201833733 | |
| Published online | 07 November 2018 | |
The radio jets of SS 433 at millimetre wavelengths
1 Departamento de Física (EPSJ), Universidad de Jaén, Campus Las Lagunillas s/n Ed. A3 Jaén 23071, Spain
e-mail: This email address is being protected from spambots. You need JavaScript enabled to view it.
2 Departamento de Ingeniería Mecánica y Minera (EPSJ), Universidad de Jaén, Campus Las Lagunillas s/n Ed. A3 Jaén 23071, Spain
e-mail: This email address is being protected from spambots. You need JavaScript enabled to view it.
3 Departament de Física Quàntica i Astrofísica, Institut de Ciències del Cosmos, Universitat de Barcelona, IEEC-UB, Martí i Franquès 1, 08028 Barcelona, Spain
Received:
28
June
2018
Accepted:
17
August
2018
Abstract
Context. SS 433 is historically a well-known microquasar in the Galaxy that has been deeply studied during the four decades elapsed since its discovery. However, observations at very high radio frequencies with good angular resolution are still very scarce in the literature. The present paper tries to partially fill this gap using archival data of the source obtained with the Atacama Large Millimeter Array (ALMA).
Aims. We aim to study the SS 433 jet properties at radio frequencies corresponding to millimetre wavelengths where the synchrotron emitting particles are expected to lose their energy much faster than at lower frequencies of centimetre wavelengths.
Methods. We applied the methods of connected radio interferometry adapted to the ALMA spectral domain for data calibration and reduction. Afterwards, the resulting map was corrected for relativistic and geometric effects. While a detailed theoretical modelling was beyond our scope, we assessed the broad evolutive properties of the jet brightness profile in the context of a semi-analytic model. Results. A resolved view of the SS 433 radio core and jets is presented. In addition to spectral index and magnetic field measurements, we are able to estimate the age of the oldest visible ejecta still radiating significantly at millimetre wavelengths. By combining our findings with those of previous authors at lower frequencies, we confirm that the energy loss of the radiating electrons is dominated by adiabatic expansion instead of synchrotron radiative losses. In addition, we find suggestive evidence for the previously proposed period of slowed expansion within the first months of the ejecta flow, needed to simultaneously match the radiative lifetime observed in the centimetre domain. Our results argue for the need for future coordinated millimetre and centimetre interferometric observations with good time sampling throughout the SS 433 precessional cycle to better understand energetic processes in stellar relativistic jets.
Key words: stars: jets / ISM: jets and outflows / X-rays: binaries / stars: individual: SS 433
© ESO 2018
1. Introduction
Object #433 in the Stephenson & Sanduleak (1977) catalogue (SS 433, also known as V1343 Aql) was discovered in the late 1970s as a very peculiar X-ray and radio star with moving emission lines in its optical spectrum (Clark & Murdin 1978; Margon et al. 1979). The circumstances of its discovery and the building of the currently widely accepted precessing jet model were first reviewed in Margon (1984). Other in-depth reviews followed decades after (e.g. Fabrika 2004). Believed to be a unique object during the first years after its identification, today we understand SS 433 to be one of the most relevant members in the microquasar family of relativistic jet sources of stellar origin (Mirabel & Rodríguez 1999; Fender et al. 2016). This group also has remarkable implications in modern high energy astrophysics (Paredes 2005; Bordas et al. 2015; MAGIC Collaboration 2018). The number of SS 433-related references in the SIMBAD Astronomical Database amounts to nearly two thousand publications to date, and SS 433-dedicated books have even been published in the past (Clark 1986).
While SS 433 has been deeply studied in almost the entire electromagnetic spectrum, observations in the millimetre domain are still not very abundant in the literature. Beyond simple flux density measurements (as in Band & Gordon 1989; Paredes et al. 2000) to molecular emission line studies of the environment (as in Lockman et al. 2007), SS 433 has seldom been explored with high angular resolution and sensitivity at millimetre wavelengths. This is in contrast with the abundant centimetre observations, with different interferometers, where the collimated bipolar jets and their proper motions at about a quarter of the speed of light are clearly seen (Vermeulen et al. 1993; Paragi et al. 1999; Blundell et al. 2001; Blundell & Bowler 2004).
In this paper we take advantage of the superb ALMA capabilities by analysing archival data of SS 433. Observing at radio frequencies well above 100 GHz allows us to sample the non-thermal emission of relativistic electrons higher in their energy power-law spectrum. In particular, here to investigate the properties of the intrinsic brightness of the SS 433 jets in this frequency regime for the first time and compare it with previous studies performed in the most traditional bands of radio astronomy (Roberts et al. 2010; Bell et al. 2011). ALMA allows us to do so with excellent subarcsecond angular resolution rivaling that achieved by the preceding generation of connected interferometers.
2. Archival observations with ALMA
We retrieved the only existing set of SS 433 observations in the ALMA archive that were conducted in the context of multi-frequency monitoring of this microquasar1. Three consecutive scheduling blocks spanning 1h each were executed starting on 2015 September 28 at 21h50m06s UTC, and ending on 2015 September 29 at 01h40m22s UTC. The instrumental set-up included four spectral windows within ALMA Band 6 centred at frequencies ν = 224, 226, 240, and 242 GHz. Each spectral window covered a Δν = 2 GHz bandwidth split into 64 channels. The corresponding central wavelengths were in the λ = 1.24–1.34 mm range. Correlator products of XX-, YY-, and XY-type were sampled with an integration time of 2 s. A total of 31 antennas in the C34-7 configuration were available. This provided baselines between 42 and 1574 m, equivalent to 25 and 1200 kλ, respectively. This array set-up enabled observations with subarcsecond angular resolution and sensitivity to angular scales as large as ∼4″.
Weather conditions were good and the system temperatures of most of the antennas used were not in excess of 100 K. The source J1751+0939 was observed as a bandpass and polarization calibrator, while J1832+0731, and occasionally J1830+0619, both within 10° of the target, were observed as phase calibrators. The flux density scale was tied to observations of the asteroid Pallas. Its accuracy in Band 6 is believed to be in the 5%–10% range. Calibration was conducted using the CASA 5.1.1-5 software package. All steps in the python scripts for calibration provided by the ALMA archive were run, and their result carefully scrutinized for improvement whenever possible by excluding bad visibilities not automatically flagged. The three calibrated measurement sets were finally concatenated into a single set using the CASA task concat for imaging.
The calibrated data were also exported into the AIPS software package of NRAO. The reason for that was to take advantage of the AIPS task DFTPL intended to easily generate light curves of stellar sources for radio photometry. The behaviour of flux density Sν as a function of time for the SS 433 central core is displayed in Fig. 1. Flaring events with amplitude ≲20 mJy are superposed onto an average value of about 80 mJy, and evolving on timescales of ∼10 min. The variable nature of SS 433 implies that self-calibration with a constant radio source model is not strictly correct. The mitigation of possible unwanted effects by subtracting a central component with time-dependent flux density is addressed in Sect. 5. The observed amplitude of variability was not dramatic most of the time (within 20%). Self-calibrating in phase and amplitude still worked in an acceptable way despite the variability issue, and improved the root-mean-square (rms) noise by nearly a factor of two in the Stokes I parameter. Maps deconvolved with the CLEAN algorithm were computed using both CASA and AIPS, yielding very similar results. The map shown in Fig. 2 was obtained using natural weight and, to our knowledge, it provides the first subarcsecond view of the microquasar jets at the 1.3 mm wavelength. Polarization maps were also obtained for Q and U Stokes parameters. However, linear polarization was only detected for the central core at a low 7σ level of ∼0.5%, which will not be discussed further in this work.
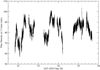 |
Fig. 1. Radio light curve of the SS 433 central core on 2015 September 28 and 29. This plot corresponds to the 224 GHz frequency (spectral window 0 of the ALMA data). The time resolution is 2 s. |
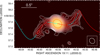 |
Fig. 2. ALMA map of SS 433 obtained on 2015 September 28 at the 1.3 mm wavelength and computed using natural weight. The restoring beam used corresponds to an elliptical Gaussian with full width at half maximum of 190 × 161 mas2, with position angle of 44°̣8 (see bottom right corner). The horizontal bar gives the angular scale, with north being up and east left. The jet kinematical model is overplotted in blue and red for approaching and receding material, respectively. Contour levels start at four times the rms noise of 32 μJy beam−1 and increase progressively by a factor of |

Measuring the SS 433 spectral index α (S ν ∝ να) was attempted by averaging the first and second spectral window pairs, and creating maps at two slightly different frequencies (about 225 and 241 GHz, respectively). Given the proximity of the frequencies being combined, the resulting spectral index map is only reliable in the vicinity of the bright central core where a nearly flat spectrum radio core is clearly observed (α = −0.01 ± 0.01). Hints of steepening to negative, non-thermal values are present towards the jets where synchrotron emission is expected to become optically thin. Unfortunately, our limited frequency coverage does not allow us a more precise measurement of α along the fainter jet flow regions.
3. Kinematic model
The expected path of the SS 433 jets has been overplotted onto Fig. 2 for the date of the observation. The paths when the jet is approaching and receding from the observer are always shown in blue and red, respectively. The kinematic model used is based on the Hjellming & Johnston (1981) formalism updated with the precession parameters derived by Eikenberry et al. (2001). Their values are based on 20 years of optical spectroscopy measuring the Doppler motion of the jet moving lines. We must note, however, that the zero-phase given by these authors actually corresponds to a precessional phase value of 0.33 because of a phase offset propagated in different papers. This phase origin issue apparently goes back to the years immediately after the discovery of SS 433. A warning about it can already be found in Section II of Margon et al. (1980). In agreement with Fabrika (2004), the adopted zero precessional phase in this paper corresponds to the Julian Day JD2443507.47 (29.97 December 1977). Nutation is not taken into account here for reasons of simplicity given that only one ALMA observing epoch is available. In addition, the induced angular displacements at ∼1″ from the core are still hard to see at the ALMA angular resolution.
The precession axis position angle cannot be determined spectroscopically. We use the historical value of 100°̣0 from the north to the east based on the Very Large Array observations by Hjellming & Johnston (1981), whose angular resolution was closer to ours than other similar estimates from Very Long Baseline Interferometry (Stirling et al. 2002). Moreover, we adopt here the canonical distance of 5.5 kpc (Lockman et al. 2007). We note that this value remains consistent with the still uncertain trigonometric parallax of SS 433 recently reported in the latest Gaia data release (Gaia Collaboration 2016), which implies a distance of  kpc (error quoted is ±1σ). The kinematic model is also used to calculate the ejection angles θ with the line of sight. These values are needed in Sect. 5 to compute the Doppler factor corrections for each jet segment.
4. Observed brightness profile
The observed profile is determined by exploring the FITS file of the interferometric map along the path given by the kinematic model. For each individual path position, we store the pixel values within a small radius (typically ≤2 pixel) and fit a least-squares plane to them. The fitted value is taken as the observed brightness level at this position. The uncertainty associated with it has three different contributions (Bell et al. 2011): the rms noise level in the image (32 μJy beam−1), the overall calibration flux error (∼5% for ALMA), and the jet path position error estimated assuming a ±10% variation in the jet velocity. All these contribution are later added in quadrature.
The outcome of this procedure applied to the Fig. 2 is displayed in Fig. 3. Any ALMA map is produced by photons emitted from different pieces of the jet that simultaneously reach the observer. Each of these pieces may be identified by its ejection age tage, which is the time elapsed in the reference frame of the core since the jet material was ejected. However, due to lighttravel effects, any of the pieces is seen as it was at an emission age τ that relates to tage according to
 (1)
(1)
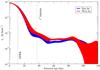 |
Fig. 3. Observed brightness profile of the SS 433 jets on 2015 September 28 at the 1.3 mm wavelength. The uncorrected jet brightness values are plotted as a function of the emission age across the jet flow. The coloured bands outline the regions of uncertainty estimated as explained in the text. The vertical bars roughly correspond to the times needed by a young emerging blob to travel the half-power beam width of one synthesized beam and its first sidelobe. Blue and red are always used for the east and west jet sides, respectively. |
where β is the jet flow velocity in units of the speed of light c and θ is the local jet angle with the line of sight predicted by the kinematic model (see Appendix A in Roberts et al. 2010 for further details). The profile in Fig. 3 is given as a function of τ for both the east and west jets.
To be cautious and to avoid over-interpretation too close to our threshold in angular resolution, we constrain our analysis to features clearly separated from the central core by at least one synthesized beam up to its first sidelobe. In our case, this secondary feature in the ALMA point spread function has a 310 milliarcsecond (mas) radius with a response still at the 10% level. Both the half-power beam width of the synthesized beam and its first sidelobe location are indicated as vertical bars in Fig. 3 and other similar plots in this work. Thus, we consider that a reliable analysis of the jet brightness profile with ALMA is feasible for emission ages older than about 40 days.
5. Intrinsic brightness profile
Here we adapt the prescription developed in Roberts et al. (2010) and Bell et al. (2011) to transform the observed brightness profile of the SS 433 jets into the intrinsic profile corrected for projection and Doppler boosting effects. Instead of a circular synthesized beam, an elliptical Gaussian shape is considered for slightly better accuracy with bmaj, bmin, and PA being its major axis, minor axis, and position angle, respectively. The correction factor needs to be computed for each sky position (xi, yi) along the jet path consisting of i = 1, N segments or steps. Its value results from the position average of the Doppler factor ![Mathematical equation: $$D_i^{n - \alpha } = {\left[ {1/\Gamma \left( {1 - \beta \cos {\theta _i}} \right)} \right]^{\left( {n - \alpha } \right)}}$$](/articles/aa/full_html/2018/11/aa33733-18/aa33733-18-eq4.gif) weighted by the synthesized beam of the interferometer. As usual, the Lorentz factor is
weighted by the synthesized beam of the interferometer. As usual, the Lorentz factor is  , and we adopt n = 2 corresponding to a continuous jet flow. For the spectral index, we use the average value α = −0.74 for the extended jets taken from Bell et al. (2011) as we cannot measure it directly beyond the SS 433 core.
Let the angular separation between the i-th sky position and any other jet segment be Δxj = xj − xi and Δyj = yj − yi, where j also runs from 1 to N. By performing a rotation towards the main axes of the Gaussian, the ith angular offsets become
 (2)
(2)
The multiplicative correction factor is then
![Mathematical equation: $${C_i} = {1 \over {{C_0}}}\sum\limits_{j = 1}^N {D_j^{n - a}\exp \left( { - 4\ln 2\left[ {{{\Delta x'_j^2} \over {b_{{\rm{maj}}}^2}} + {{\Delta y'_j^2} \over {b_{{\rm{min}}}^2}}} \right]} \right)} ,$$](/articles/aa/full_html/2018/11/aa33733-18/aa33733-18-eq7.gif) (3)
(3)
where the factor C0 stands for normalization to unity at the core origin. In practice, the summation is extended up to ejection ages of 500 d, which is a safe limit in our case to ensure that all relevant terms are included.
The result of numerically evaluating Eq. (3) using the jet geometry of the ALMA observing date is shown in Fig. 4. The factor 1/Ci to be applied to the observed brightness profile is plotted for the east and west jet sides.
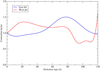 |
Fig. 4. Multiplicative correction factors 1/Ci to recover the intrinsic jet brightness profiles from the observed ones on 2015 September 28. They are plotted as a function of the emission age across the east and west jet flows, shown in blue and red, respectively. The point spread function assumed is the same elliptical Gaussian (190 × 161 mas2, with position angle of 44°̣8) used as a restoring beam in Fig. 2. |
Before applying the correction, the SS 433 central compact nucleus needs to be removed from the Fig. 3 data since our analysis is not meaningful below our angular resolution limits. We have applied two different methods for this purpose. First, we removed from the visibility, in the Fourier plane, a variable point source at the SS 433 core position. Its flux density was interpolated between the points of Fig. 1 using an AIPS custom task. The result is shown in Fig. 5. Second, we removed, also in the Fourier plane, the brightest clean components closer than the first sidelobe of the synthesized beam from the central SS 433 position. The AIPS task UVSUB was used to perform this procedure. The result is shown in Fig. 6. In both cases the result is very similar for ages older than ∼40 d. The application of the Eq. (3) correction factors renders the intrinsic brightness profiles of both jets consistent with being symmetrical, even at millimetre wavelengths.
 |
Fig. 5. Intrinsic brightness profile of the SS 433 jets on 2015 September 28 plotted as in Fig. 3, but with Doppler boosting and projection effects being corrected. The central core has been modelled as a variable point source and fully subtracted in the Fourier plane, which causes the flux density to drop to zero at the origin. |
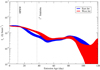 |
Fig. 6. Another estimate of the intrinsic brightness profile of the SS 433 jets on 2015 September 28. In this figure, the central core has been modelled according to the brightest CLEAN components in the core vicinity and subtracted in the Fourier plane. This procedure leaves some non-zero residual flux density at the origin. |
6. Discussion
The consistence with a symmetric jet brightness profile, evidenced in Figs. 5 and 6 after correcting for projection and beaming effects, confirms the previous similar findings at centimetre wavelengths in Bell et al. (2011). Symmetry, however, does not mean that the jet brightness profile follows a smooth decay. Although we cannot perform true evolutionary studies, because only one ALMA observing epoch is available, we do have some information about the brightness profile as a function of the emission age at the epoch of observation. Beyond our τ ≳ 40 d threshold, the two profiles in Figs. 5 and 6 show a slightly increasing trend for 55 d ≲ τ ≲ 85 d. This behaviour is preceded and followed by intervals of brightness decay for 45 d ≲ τ ≲ 55 d and 85 d ≲ τ ≲ 120 d, respectively. Decline, levelling-of,f and decline again is a pattern already observed in the SS 433 jets at centimetre wavelengths, as mentioned in Roberts et al. (2010). The flattening of the decay curve may reflect the effects of previous variability in the core, whose modelling would require some assumptions on the variable power injection. On the other hand, the decaying sections are more likely related to ageing of the ejected radiating particles. Assuming that the radio emission is of synchrotron origin, the lifetime τs of a relativistic electron energetic enough to radiate at an ALMA frequency ν under the effects of a magnetic field B is given by
![Mathematical equation: $${\tau _{\rm{s}}} = 69.4\;{\rm{yr}}{\left[ {{B \over {10\;{\rm{mG}}}}} \right]^{ - 3/2}}{\left[ {{\nu \over {233\;{\rm{GHz}}}}} \right]^{ - 1/2}}.$$](/articles/aa/full_html/2018/11/aa33733-18/aa33733-18-eq8.gif) (4)
(4)
This equation is adapted to the mean frequency (233 GHz) of all our ALMA bands. A first estimate of the magnetic field can be obtained from equipartition arguments using the formalism described in Pacholczyk (1970). The deconvolved angular size of the flat-spectrum radio core in Fig. 2 is about 60 × 40 mas2. The SS 433 average flux density at the central ALMA frequency of 233 GHz was about 88 mJy. This is within a factor of ≲2 from the quiescent emission level S ν = 1.23 Jy(ν/GHz)−0.6 ± 0.02 estimated by Seaquist et al. (1982). The resulting equipartition field is then 30 mG.
The radiative lifetime of electrons given by Eq. (4) is then longer than a decade, while the jet emission in our ALMA map reaching angular scales up to 1″̣5 does not exceed an age of about 100 d. Therefore, synchrotron energy losses do not seem to play a dominant role, and the faster decay of ALMA emission suggests that another mechanism is at work.
At this point, expansion losses come as a plausible alternative to explain the overall brightness decay of the SS 433 jets, as already proposed many years ago in the conical symmetric jet models of radio emitting X-ray binaries developed by Hjellming & Johnston (1988). Of course, we are excluding eventual brightness enhancement episodes due to the core variability which are beyond the scope of the qualitative assessment intended here. The semi-analytic Hjellming & Johnston (1988) model considers that jet plasma is injected with bulk velocity v at a distance z0 from the core, being r0 the jet radius at this point. Relativistic effects are not properly addressed in the context of this model, but being SS 433 a mildly relativistic system this is not a serious drawback for a first-order analysis. In particular, the original model equations use a Newtonian time t, equivalent to our tage variable, whose difference with τ is neglected for simple estimative purposes. Moreover, the jet is assumed to expand adiabatically in the lateral direction according to r = r0(z/z0)p, where z is the distance from the core and p a power-law index that parametrizes the expansion rate. Free expansion is achieved when p = 1, while p < 1 provides slowed lateral expansion. We also have z = z0(t/t0), where t0 = z0/v is an arbitrary reference time. Assuming flux conservation, the dominant magnetic field component is the one perpendicular to the jet axis, scaling as B = B0(r/r0)−1 = B0(z/z0)−p. For simplicity, the helical structure of the SS 433 jets is deliberately ignored.
To estimate whether the jet extent, as a function of frequency, agrees or not with adiabatic expansion dominating over radiative losses under the above assumptions, we rewrite the optically thin brightness profile given in Eq. (14) of Hjellming & Johnston (1988) as
 (5)
(5)
This approximation is appropriate at large distances from the central source where the jet optical depth is expected to drop well below unity. Here S ν is the local jet flux density in this optically thin regime of synchrotron emission. We also define the radio spectral index α as S ν ∝ να. From synchrotron theory (Pacholczyk 1970) α = (1 − γ)/2, where γ is the power-law index of the energy distribution of relativistic electrons. On the other hand, the constant δ is equal to 0 or 1, equivalent to the representative cases of free and slowed expansion (with p = 1or p = 1/2, respectively).
At our average ALMA frequency (ν1 ≃ 233 GHz), the oldest ejecta visible (4σ level) has an age t1 ≃ 90 d and has travelled as far away as z1/D ≃ 1″̣5. How does this compare with observations at lower frequencies? Let us assume that we can sample the jet up to some minimum threshold values (dS ν1/dz)min and (dS ν2/dz)min, both dependent on instrumental sensitivity. Considering Eq. (5) for two frequencies to be compared (here ν2 < ν1), and taking their equation ratio, we obtain
![Mathematical equation: $${t_2} = t{ & _1}{\left[ {{{\left( {dS\;{\nu _1}/{\rm{d}}z} \right)\min } \over {\left( {dS\;{\nu _2}/{\rm{d}}z} \right)\min }}} \right]^{{{\left( {6 + 6\delta } \right)} \over {\left( {7\gamma - 1} \right)}}}}{\left[ {{{{\nu _1}} \over {{\nu _2}}}} \right]^{{{\left( {3 + 3\delta } \right)\left( {\gamma - 1} \right)} \over {\left( {7\gamma - 1} \right)}}}}.$$](/articles/aa/full_html/2018/11/aa33733-18/aa33733-18-eq10.gif) (6)
(6)
The ratio of minimum profile values, both at the same significance level, is in the same proportion as the quotient of the respective rms noises in the different frequency maps. Here we are comparing our ALMA observations with the Bell et al. (2011) and Roberts et al. (2010) VLA maps at centimetre wavelengths (C-band, ν2 = 5 GHz). The corresponding rms noise values are 32, 40, and 13 μJy beam−1. Scaling by the different beam solid angles, these numbers are equivalent to 1332, 357, and 75 μJy arcsecond−2, respectively. The optically thin spectral index is taken as α = −0.74 from the same multi-frequency data of Bell et al. (2011); hence γ = 2.48.
Now we can tentatively explore different options with the values stated above. If the jet expansion proceeds in a slowed way (δ = 1), Eq. (6) predicts that the two C-band observations with the VLA should reveal the jets up to t2 ≃ 1900 d and ∼ 6000 d, that is, more than 5 and 16 years after ejection (z2/D ≃ 15″ − 45″). Clearly this is hard to reconcile with the Bell et al. (2011) and Roberts et al. (2010) images where the oldest ejecta is about 500 d and 800 d, or 1.4 and 2.2 years old, extending over only a few arcseconds.
We recall here that Hjellming & Johnston (1988) pointed out the possibility that jet expansion could transition from a slowed to a free stage some time after ejection. A difference in the ambient conditions could be a conceivable physical reason behind this change. Intuitively, faster free expansion enhances the adiabatic energy losses of the radiating electrons, thus leading to an earlier brightness decay compared to slowed expansion. To quantify this effect, let tslow be the maximum duration of the slowed expansion phase. Beyond zslow = vtslow, or t ≥ tslow, the jet profile evolution given by Eq. (5) must begin to evolve with a δ = 0 behaviour. The corresponding expression that ensures continuity is
 (7)
(7)
Now if the terminal visible ejecta at frequencies ν1 and ν2 are under the regimes of Eqs. (5) and (7), and we take their ratio again, their respective ages relate according to
 (8)
(8)
The threshold profile values are also to be replaced by the previous rms noise values per squared arcsecond. The Eq. (8) predictions have been plotted in Fig. 7 for different values of tslow ranging from t1 = 90 d onwards. As we can see, getting the faintest C-band visible ejecta with an age of about 500 d and 800 d is feasible, but it requires an initial slowed expansion phase lasting for tslow ≃ 110 and 130 d before free expansion gets in. The consistency of the two tslow estimates, both pointing to a four-month interval, is really remarkable given the very different sensitivities of the VLA observations involved. The ALMA jets can no longer be traced during the following unimpeded expansion regime.
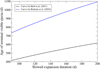 |
Fig. 7. Age of the oldest visible ejecta in VLA C-band (5 GHz) published maps consistent with the observed jet properties in ALMA observations centred at 233 GHz according to Eq. (8). Different values of the slowed expansion duration are assumed. |
Adiabatic losses thus appear to be a plausible effect that can help us understand the overall radio properties of SS 433 from centimetre to millimetre wavelengths. The details of the jet evolution require a modelling work that is more sophisticated than our simple analysis aimed at identifying the most relevant energetic effects.
7. Conclusions
We have reported the results of archival ALMA observations of the microquasar SS 433 that provide a resolved view of its precessing radio jets at millimetre wavelengths. In addition to this new image, our main findings can be summarized as follows:
The central core is highly variable with ±20% amplitude flares in the millimetre domain, evolving on ∼103 s timescales. Its spectral index is nearly flat with hints of steepening towards optically thin values at larger angular distances. This is in agreement with previous observations at lower radio frequencies. A magnetic field value of 30 mG is found from equipartition arguments given the core deconvolved angular size of tens of mas.
The observed jet path, as imaged with ALMA, agrees remarkably well with the kinematic model prediction using the Eikenberry et al. (2001) parameters. Emission from both jets of SS 433 is detected up to ∼1″̣5 from the central core. This is equivalent to emission ages of about 90 d for the oldest jet components detected.
The jet flow appears to be symmetric after accounting for Doppler boosting and projection effects. The brightness profiles of the two jets have an overall decaying trend, although not in a strictly monotonic way. This is also consistent with previous images in the centimetre domain.
Radiative synchrotron losses are not very relevant for the energetic evolution of the radio emitting particles. In contrast, we confirm the early results in the work of Hjellming & Johnston (1988) where adiabatic expansion losses played a dominant role. Moreover, the jet expansion needs to proceed at a slowed pace for about four months after ejection before a free expansion regime is achieved. Only in this way are we able to simultaneously account for the different radiative lifetimes derived from the overall jet properties in ALMA and VLA radio images.
Project Id. ADS/JAO.ALMA#2013.1.01369.S, PI K. Blundell.
Acknowledgments
This paper makes use of the following ALMA data: ADS/JAO.ALMA#2013.1.01369.S. ALMA is a partnership of ESO (representing its member states), NSF (USA) and NINS (Japan), together with NRC (Canada) and NSC and ASIAA (Taiwan) and KASI (Republic of Korea), in cooperation with the Republic of Chile. The Joint ALMA Observatory is operated by ESO, AUI/NRAO, and NAOJ. The National Radio Astronomy Observatory is a facility of the National Science Foundation operated under cooperative agreement by Associated Universities, Inc. This work was supported by the Agencia Estatal de Investigación grants AYA2016-76012-C3-1-P and AYA2016-76012-C3-3-P from the Spanish Ministerio de Economía y Competitividad (MINECO); by the Consejería de Economía, Innovación, Ciencia y Empleo of Junta de Andalucía under research group FQM-322; by grant MDM-2014-0369 of the ICCUB (Unidad de Excelencia “María de Maeztu”); and by the Catalan DEC grant 2014 SGR 86, as well as FEDER funds.
References
- Band, D. L., & Gordon, M. A. 1989, ApJ, 338, 945 [NASA ADS] [CrossRef] [Google Scholar]
- Bell, M. R., Roberts, D. H., & Wardle, J. F. C. 2011, ApJ, 736, 118 [NASA ADS] [CrossRef] [Google Scholar]
- Blundell, K. M., & Bowler, M. G. 2004, ApJ, 616, L159 [NASA ADS] [CrossRef] [Google Scholar]
- Blundell, K. M., Mioduszewski, A. J., Muxlow, T. W. B., Podsiadlowski, P., & Rupen, M. P. 2001, ApJ, 562, L79 [NASA ADS] [CrossRef] [Google Scholar]
- Bordas, P., Yang, R., Kafexhiu, E., & Aharonian, F. 2015, ApJ, 807, L8 [NASA ADS] [CrossRef] [Google Scholar]
- Clark, D. 1986, Quest for Ss433 (Penguin Books) [Google Scholar]
- Clark, D. H., & Murdin, P. 1978, Nature, 276, 44 [NASA ADS] [CrossRef] [Google Scholar]
- Eikenberry, S. S., Cameron, P. B., Fierce, B. W., et al. 2001, ApJ, 561, 1027 [NASA ADS] [CrossRef] [Google Scholar]
- Fabrika, S. 2004, Astrophys. Space Phys. Rev., 12, 1 [NASA ADS] [Google Scholar]
- Fender, R., & Muñoz-Darias, T. 2016, in Lecture Notes in Physics, eds. F. Haardt, V. Gorini, U. Moschella, A. Treves, & M. Colpi (Berlin: Springer Verlag), 905, 65 [Google Scholar]
- Gaia Collaboration (Prusti, T., et al.) 2016, A&A, 595, A1 [NASA ADS] [CrossRef] [EDP Sciences] [Google Scholar]
- Hjellming, R. M., & Johnston, K. J. 1981, ApJ, 246, L141 [NASA ADS] [CrossRef] [Google Scholar]
- Hjellming, R. M., & Johnston, K. J. 1988, ApJ, 328, 600 [NASA ADS] [CrossRef] [Google Scholar]
- Lockman, F. J., Blundell, K. M., & Goss, W. M. 2007, MNRAS, 381, 881 [NASA ADS] [CrossRef] [Google Scholar]
- MAGIC Collaboration 2018, A&A, 612, A14 [NASA ADS] [CrossRef] [EDP Sciences] [Google Scholar]
- Margon, B. 1984, ARA&A, 22, 507 [NASA ADS] [CrossRef] [Google Scholar]
- Margon, B., Ford, H. C., Katz, J. I., et al. 1979, ApJ, 230, L41 [NASA ADS] [CrossRef] [Google Scholar]
- Margon, B., Grandi, S. A., & Downes, R. A. 1980, ApJ, 241, 306 [NASA ADS] [CrossRef] [Google Scholar]
- Mirabel, I. F., & Rodríguez, L. F. 1999, ARA&A, 37, 409 [NASA ADS] [CrossRef] [Google Scholar]
- Pacholczyk, A. G. 1970, Radio Astrophysics. Nonthermal Processes in Galactic and Extragalactic Sources [Google Scholar]
- Paragi, Z., Vermeulen, R. C., Fejes, I., et al. 1999, A&A, 348, 910 [NASA ADS] [Google Scholar]
- Paredes, J. M. 2005, Ap&SS, 300, 267 [NASA ADS] [CrossRef] [Google Scholar]
- Paredes, J. M., Martí, J., Peracaula, M., Pooley, G., & Mirabel, I. F. 2000, A&A, 357, 507 [NASA ADS] [Google Scholar]
- Roberts, D. H., Wardle, J. F. C., Bell, M. R., et al. 2010, ApJ, 719, 1918 [NASA ADS] [CrossRef] [Google Scholar]
- Seaquist, E. R., Gilmore, W. S., Johnston, K. J., & Grindlay, J. E. 1982, ApJ, 260, 220 [NASA ADS] [CrossRef] [Google Scholar]
- Stephenson, C. B., & Sanduleak, N. 1977, ApJS, 33, 459 [NASA ADS] [CrossRef] [Google Scholar]
- Stirling, A. M., Jowett, F. H., Spencer, R. E., et al. 2002, MNRAS, 337, 657 [NASA ADS] [CrossRef] [Google Scholar]
- Vermeulen, R. C., Schilizzi, R. T., Spencer, R. E., Romney, J. D., & Fejes, I. 1993, A&A, 270, 177 [NASA ADS] [Google Scholar]
All Figures
|
Fig. 1. Radio light curve of the SS 433 central core on 2015 September 28 and 29. This plot corresponds to the 224 GHz frequency (spectral window 0 of the ALMA data). The time resolution is 2 s. |
| In the text | |
|
Fig. 2. ALMA map of SS 433 obtained on 2015 September 28 at the 1.3 mm wavelength and computed using natural weight. The restoring beam used corresponds to an elliptical Gaussian with full width at half maximum of 190 × 161 mas2, with position angle of 44°̣8 (see bottom right corner). The horizontal bar gives the angular scale, with north being up and east left. The jet kinematical model is overplotted in blue and red for approaching and receding material, respectively. Contour levels start at four times the rms noise of 32 μJy beam−1 and increase progressively by a factor of |
| In the text | |
|
Fig. 3. Observed brightness profile of the SS 433 jets on 2015 September 28 at the 1.3 mm wavelength. The uncorrected jet brightness values are plotted as a function of the emission age across the jet flow. The coloured bands outline the regions of uncertainty estimated as explained in the text. The vertical bars roughly correspond to the times needed by a young emerging blob to travel the half-power beam width of one synthesized beam and its first sidelobe. Blue and red are always used for the east and west jet sides, respectively. |
| In the text | |
|
Fig. 4. Multiplicative correction factors 1/Ci to recover the intrinsic jet brightness profiles from the observed ones on 2015 September 28. They are plotted as a function of the emission age across the east and west jet flows, shown in blue and red, respectively. The point spread function assumed is the same elliptical Gaussian (190 × 161 mas2, with position angle of 44°̣8) used as a restoring beam in Fig. 2. |
| In the text | |
|
Fig. 5. Intrinsic brightness profile of the SS 433 jets on 2015 September 28 plotted as in Fig. 3, but with Doppler boosting and projection effects being corrected. The central core has been modelled as a variable point source and fully subtracted in the Fourier plane, which causes the flux density to drop to zero at the origin. |
| In the text | |
|
Fig. 6. Another estimate of the intrinsic brightness profile of the SS 433 jets on 2015 September 28. In this figure, the central core has been modelled according to the brightest CLEAN components in the core vicinity and subtracted in the Fourier plane. This procedure leaves some non-zero residual flux density at the origin. |
| In the text | |
|
Fig. 7. Age of the oldest visible ejecta in VLA C-band (5 GHz) published maps consistent with the observed jet properties in ALMA observations centred at 233 GHz according to Eq. (8). Different values of the slowed expansion duration are assumed. |
| In the text | |
Current usage metrics show cumulative count of Article Views (full-text article views including HTML views, PDF and ePub downloads, according to the available data) and Abstracts Views on Vision4Press platform.
Data correspond to usage on the plateform after 2015. The current usage metrics is available 48-96 hours after online publication and is updated daily on week days.
Initial download of the metrics may take a while.