Fig. 5
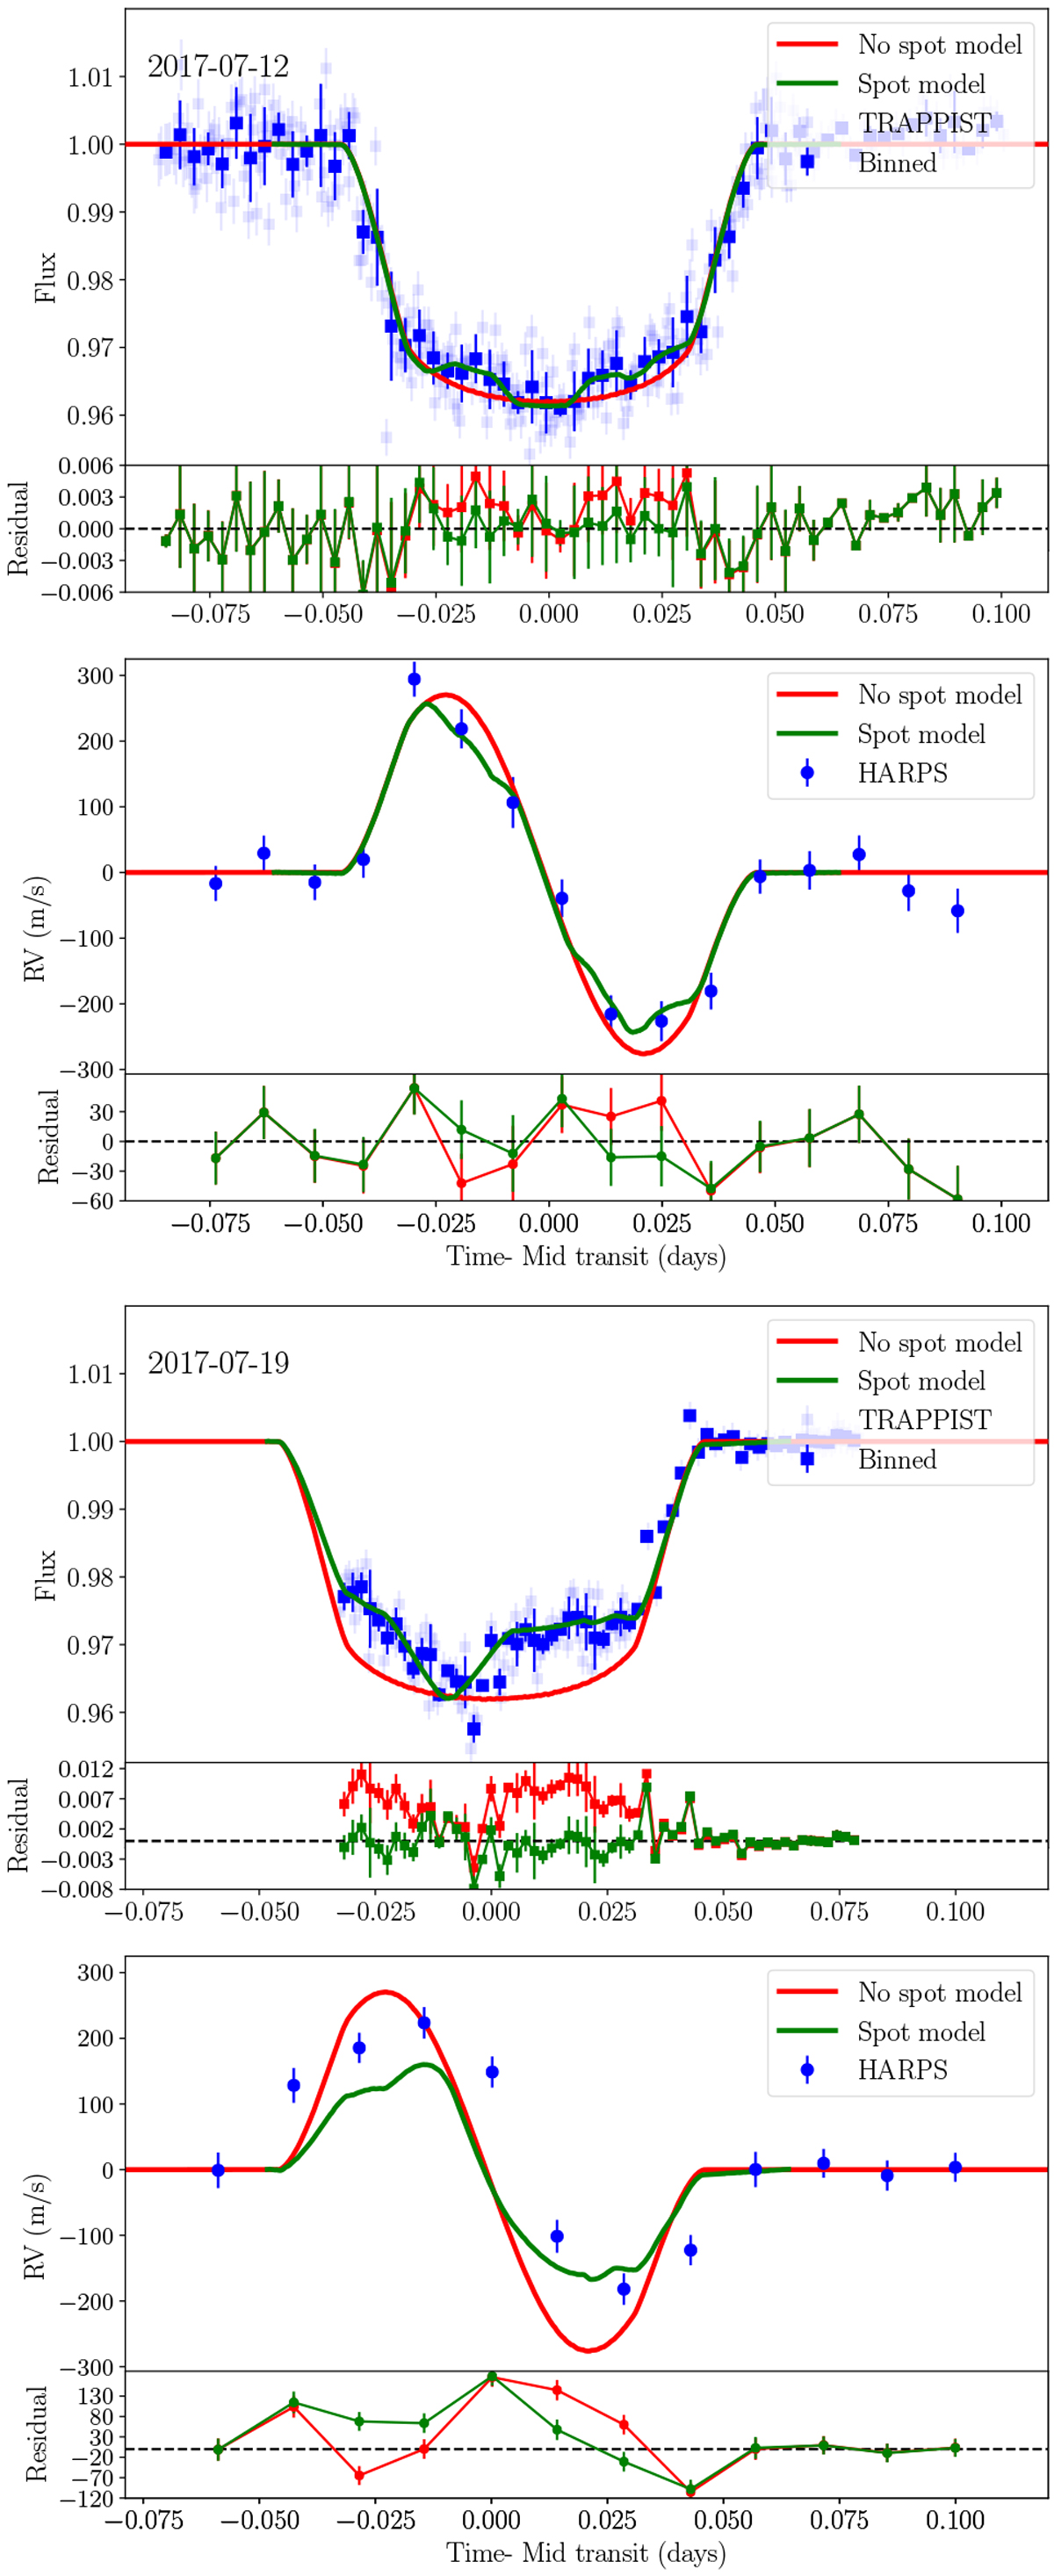
Simultaneous photometric transit and RM observation of CoRoT-2b on the night of 12 July 2017 (top panels) and on night thenight of 19 July 2017 (bottom panels). The dark blue square represents the binned TRAPPIST photometric observations, and the dark blue filled circle the HARPS RM observation. The red line is the SOAP3.0 model without considering any stellar active regions. The green lines are the SOAP3.0 best fitted model to transit light curve taking into accountthree spots.
Current usage metrics show cumulative count of Article Views (full-text article views including HTML views, PDF and ePub downloads, according to the available data) and Abstracts Views on Vision4Press platform.
Data correspond to usage on the plateform after 2015. The current usage metrics is available 48-96 hours after online publication and is updated daily on week days.
Initial download of the metrics may take a while.