Fig. 3
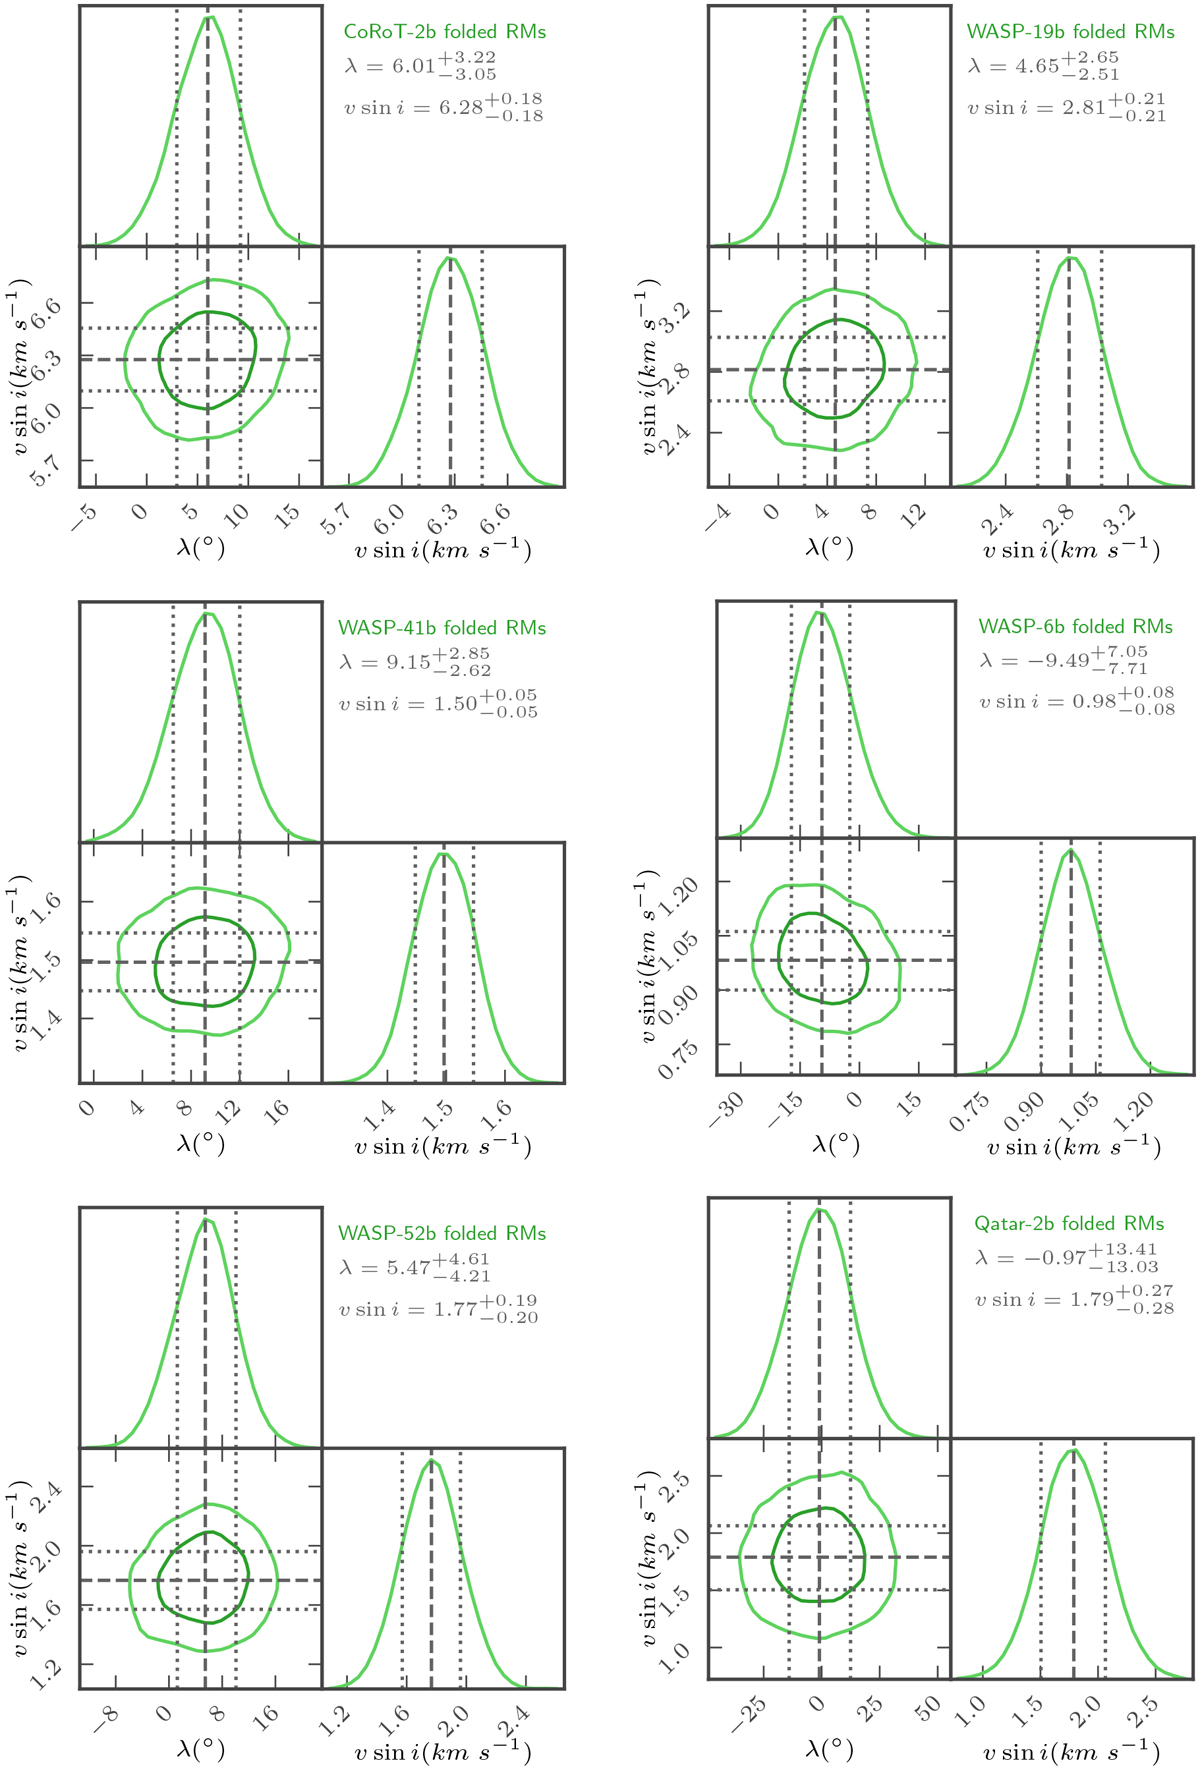
Posterior probability distributions in vsini − λ parameter space of all our targets obtained from the fit to the folded RM observations. Each panel shows different planetary system. The black dashed line displays median values of the posterior distributions, and the 1σ uncertainties taken to be the value enclosed in the 68.3% of the posterior distributions are shown with the black dotted line.
Current usage metrics show cumulative count of Article Views (full-text article views including HTML views, PDF and ePub downloads, according to the available data) and Abstracts Views on Vision4Press platform.
Data correspond to usage on the plateform after 2015. The current usage metrics is available 48-96 hours after online publication and is updated daily on week days.
Initial download of the metrics may take a while.