Free Access
Fig. 2
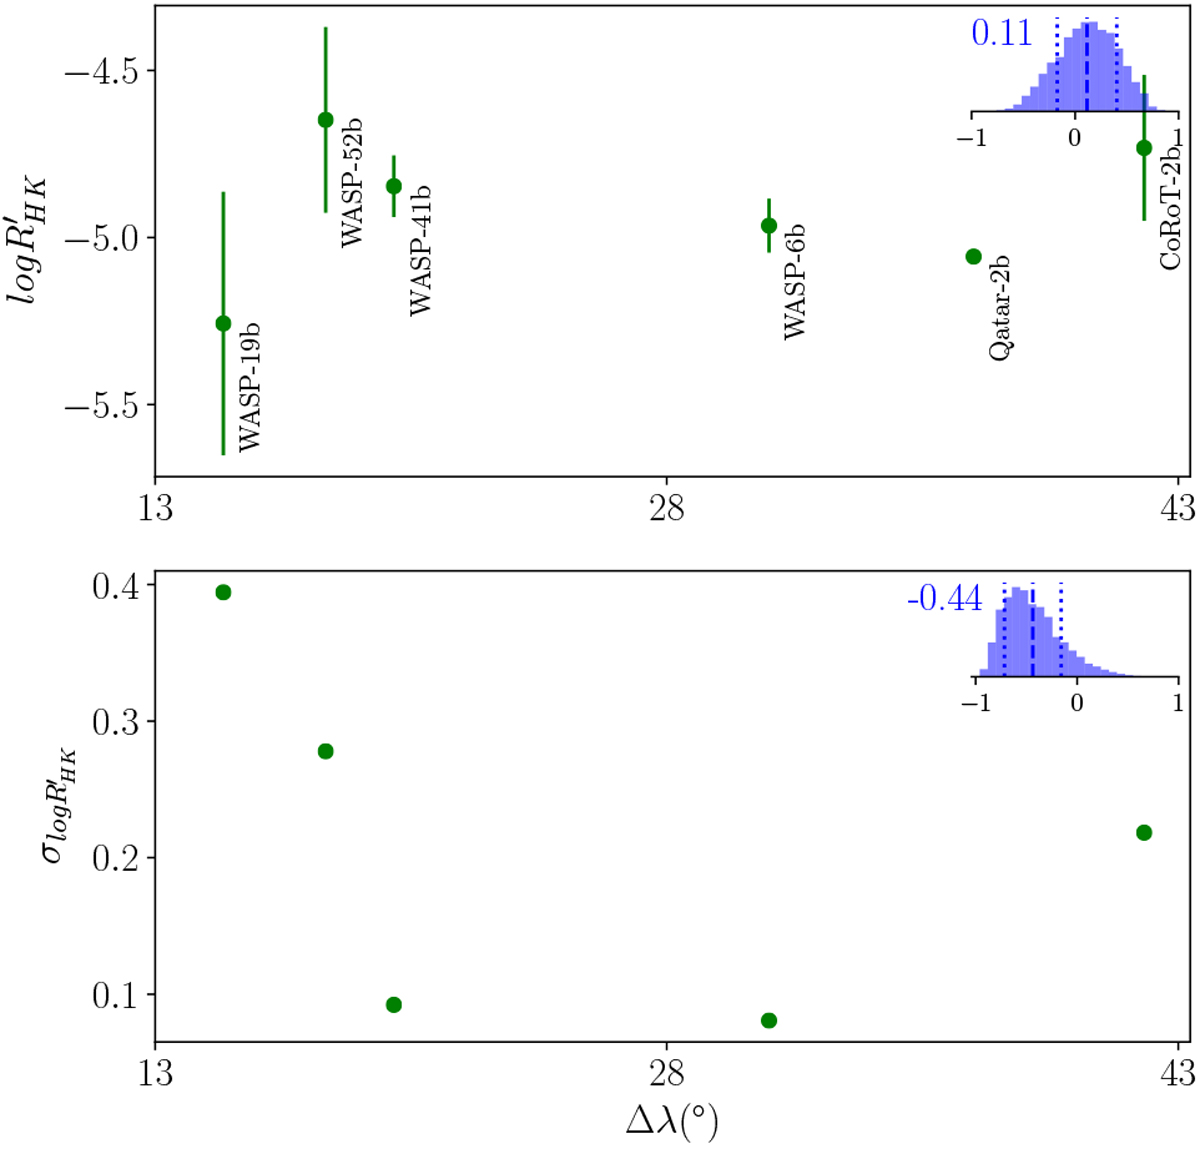
Top panel: correlations between Δλ and log ![]() . At the top right the calculated value of ρ and also its posterior distribution is presented. The dashed vertical lines indicate the 68% highest posterior density credible intervals (Figueira et al. 2016). Bottom panel: same as top but for Δ λ and
. At the top right the calculated value of ρ and also its posterior distribution is presented. The dashed vertical lines indicate the 68% highest posterior density credible intervals (Figueira et al. 2016). Bottom panel: same as top but for Δ λ and ![]() .
.
Current usage metrics show cumulative count of Article Views (full-text article views including HTML views, PDF and ePub downloads, according to the available data) and Abstracts Views on Vision4Press platform.
Data correspond to usage on the plateform after 2015. The current usage metrics is available 48-96 hours after online publication and is updated daily on week days.
Initial download of the metrics may take a while.