Fig. 6.
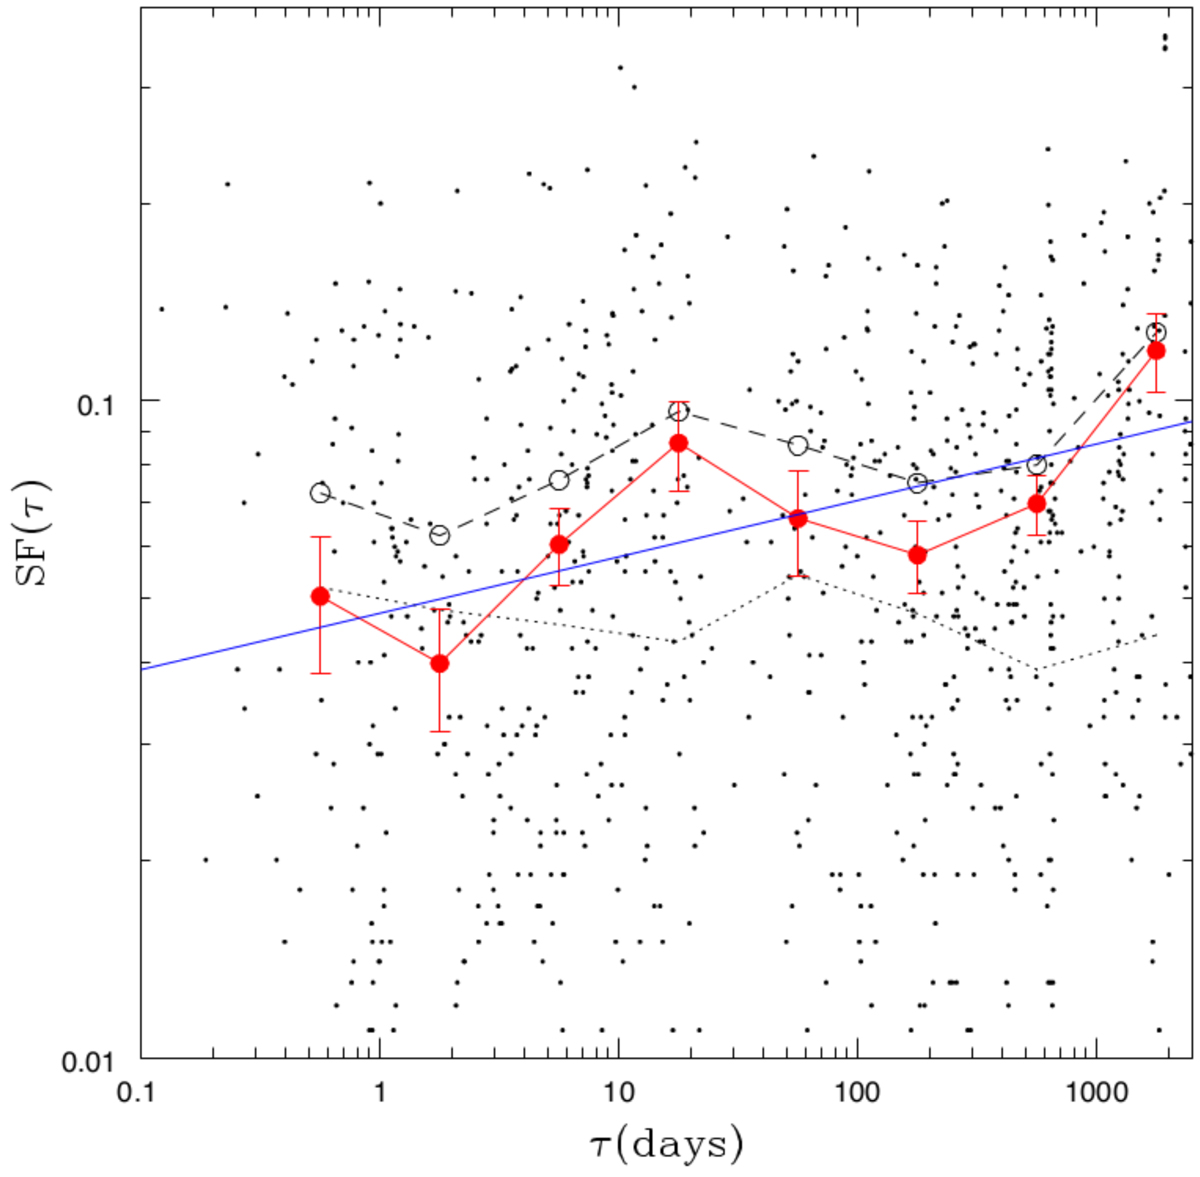
Structure function SF(τ) of the αOX index as a function of the time-lag τ for the multi-epoch objects in the reference sample. The dotted line is the noise level; the dashed line is the “uncorrected” structure function (i.e. without noise subtraction); the red line is the “corrected” SF, where red points are representative values of bins; the blue straight line is a weighted least-squares fit to the “corrected” SF. Error bars represent the 1-σ dispersion of the distribution of points in each bin.
Current usage metrics show cumulative count of Article Views (full-text article views including HTML views, PDF and ePub downloads, according to the available data) and Abstracts Views on Vision4Press platform.
Data correspond to usage on the plateform after 2015. The current usage metrics is available 48-96 hours after online publication and is updated daily on week days.
Initial download of the metrics may take a while.