Fig. 3.
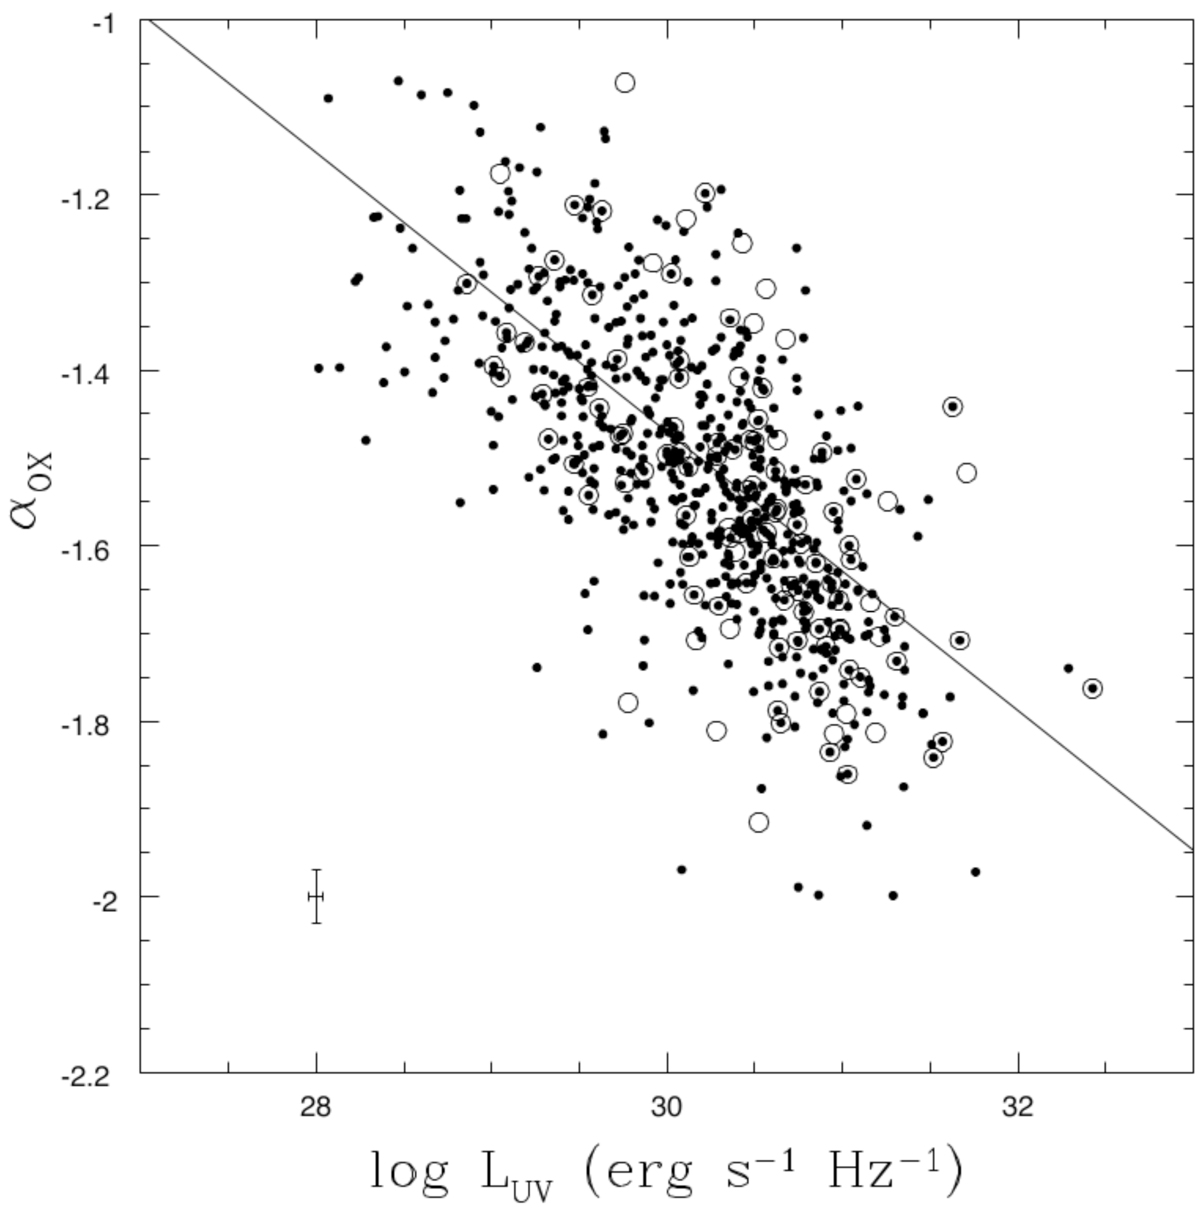
αOX as a function of the UV luminosity for the objects in the reference sample (black points) and for comparison empty circles represent objects from Vagnetti et al. (2010); empty circles with a black point inside represent objects belonging to both groups. The straight line is the linear least squares fit to the data considering only the reference sample. Average uncertainties on the two quantities are shown with a representative point with error bars.
Current usage metrics show cumulative count of Article Views (full-text article views including HTML views, PDF and ePub downloads, according to the available data) and Abstracts Views on Vision4Press platform.
Data correspond to usage on the plateform after 2015. The current usage metrics is available 48-96 hours after online publication and is updated daily on week days.
Initial download of the metrics may take a while.