Fig. 2.
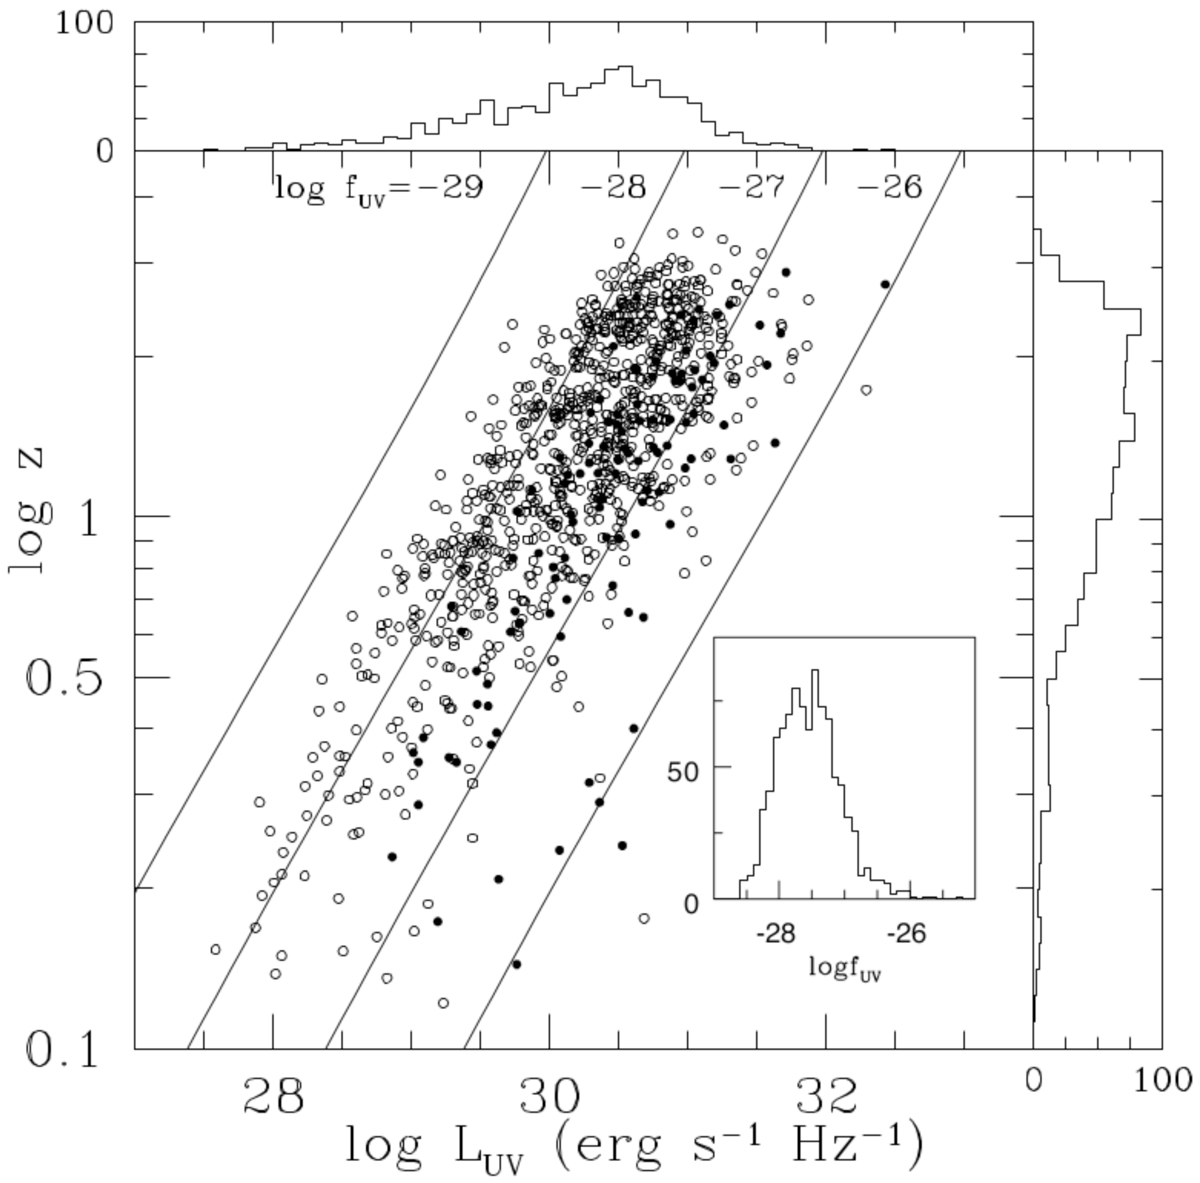
Distribution of the parent sample in the LUV-z plane. Straight lines are lines of constant UV flux. Black circles represent objects in common with Vagnetti et al. (2010), empty circles are objects present only in this work. The straight lines are constant UV flux lines. The histogram on top shows the distribution of objects in the parent sample with respect to UV luminosity; the histogram on the right shows the redshift distribution of objects in the parent sample. The histogram inside the plot area (lower-right) shows the distribution of objects in the parent sample with respect to UV flux.
Current usage metrics show cumulative count of Article Views (full-text article views including HTML views, PDF and ePub downloads, according to the available data) and Abstracts Views on Vision4Press platform.
Data correspond to usage on the plateform after 2015. The current usage metrics is available 48-96 hours after online publication and is updated daily on week days.
Initial download of the metrics may take a while.