Fig. 6.
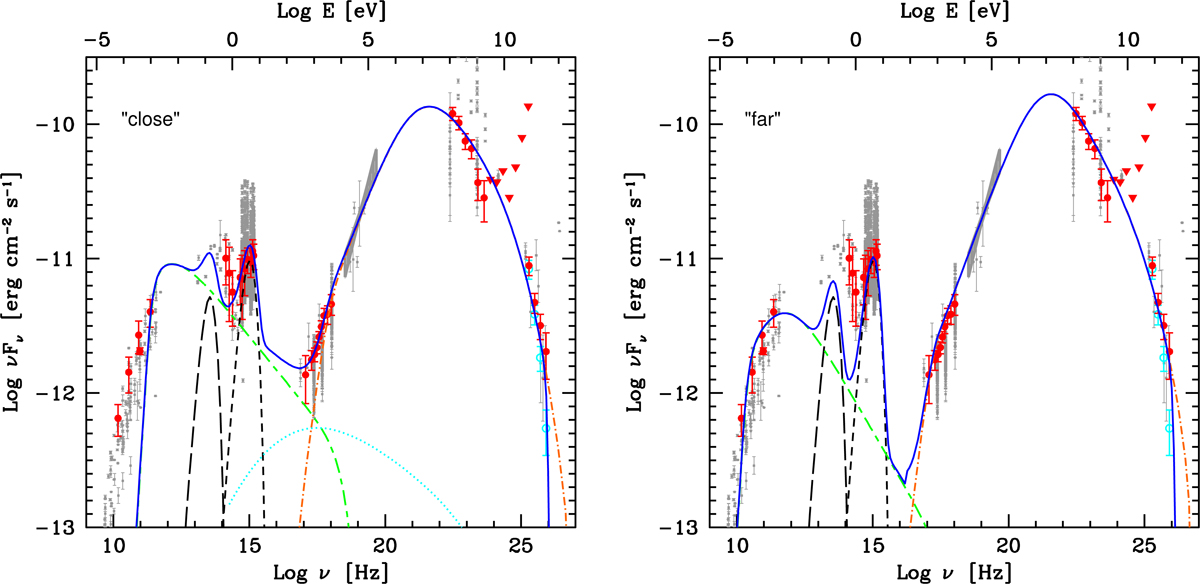
Multiwavelength SED of PKS 1510–089 obtained from the data contemporaneous to MAGIC observations performed during Fermi-LAT low state (red points). The gray band shows the Swift-BAT 105-month average spectrum (Oh et al. 2018). Gray dot markers show the historical data from SSDC (www.asdc.asi.it). IR optical and UV data have been dereddened, MAGIC data have been corrected for the absorption by the EBL according to Domínguez et al. (2011) model. Observed MAGIC spectral points are shown in cyan. The green short-long-dashed curve shows the synchrotron component, and orange dot-dashed curve the EC component. The SSC component is shown as a cyan dotted line. The long dashed and short dashed black lines show the dust torus and accretion disk emission, respectively. The solid blue line shows the total emission (including absorption in EBL). Left panel: close model, right panel: far model (see the text).
Current usage metrics show cumulative count of Article Views (full-text article views including HTML views, PDF and ePub downloads, according to the available data) and Abstracts Views on Vision4Press platform.
Data correspond to usage on the plateform after 2015. The current usage metrics is available 48-96 hours after online publication and is updated daily on week days.
Initial download of the metrics may take a while.