Fig. 4.
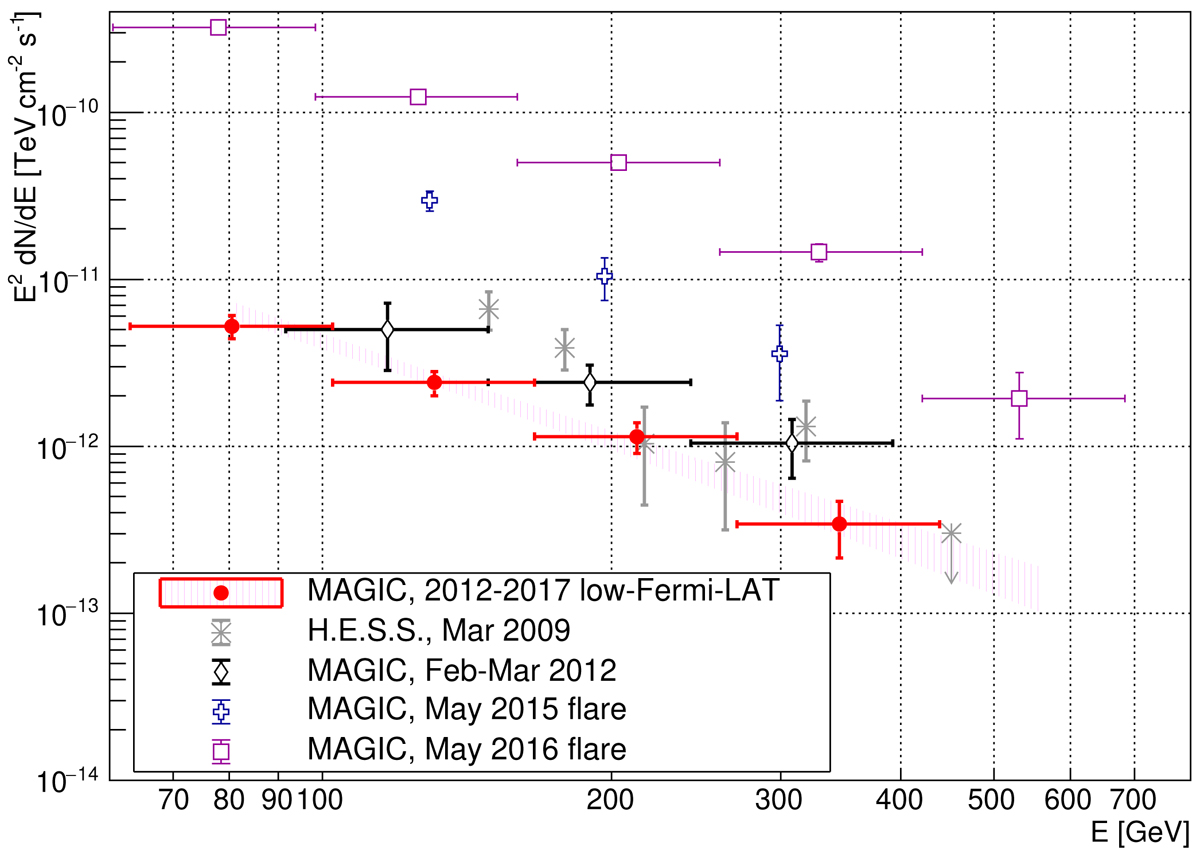
Spectral energy distribution (SED) of PKS 1510–089 during the low state (red filled points and shaded magenta region) compared to historical measurements (open symbols): high state in March 2009 (gray stars, H.E.S.S. Collaboration 2013), high state in February–March 2012 (black diamonds, Aleksić et al. 2014), flare in May 2015 (blue crosses, Ahnen et al. 2017a), and flare in May 2016 (magenta squares, Zacharias et al. 2017b). The spectra are not deabsorbed from the EBL extinction.
Current usage metrics show cumulative count of Article Views (full-text article views including HTML views, PDF and ePub downloads, according to the available data) and Abstracts Views on Vision4Press platform.
Data correspond to usage on the plateform after 2015. The current usage metrics is available 48-96 hours after online publication and is updated daily on week days.
Initial download of the metrics may take a while.