Fig. 3.
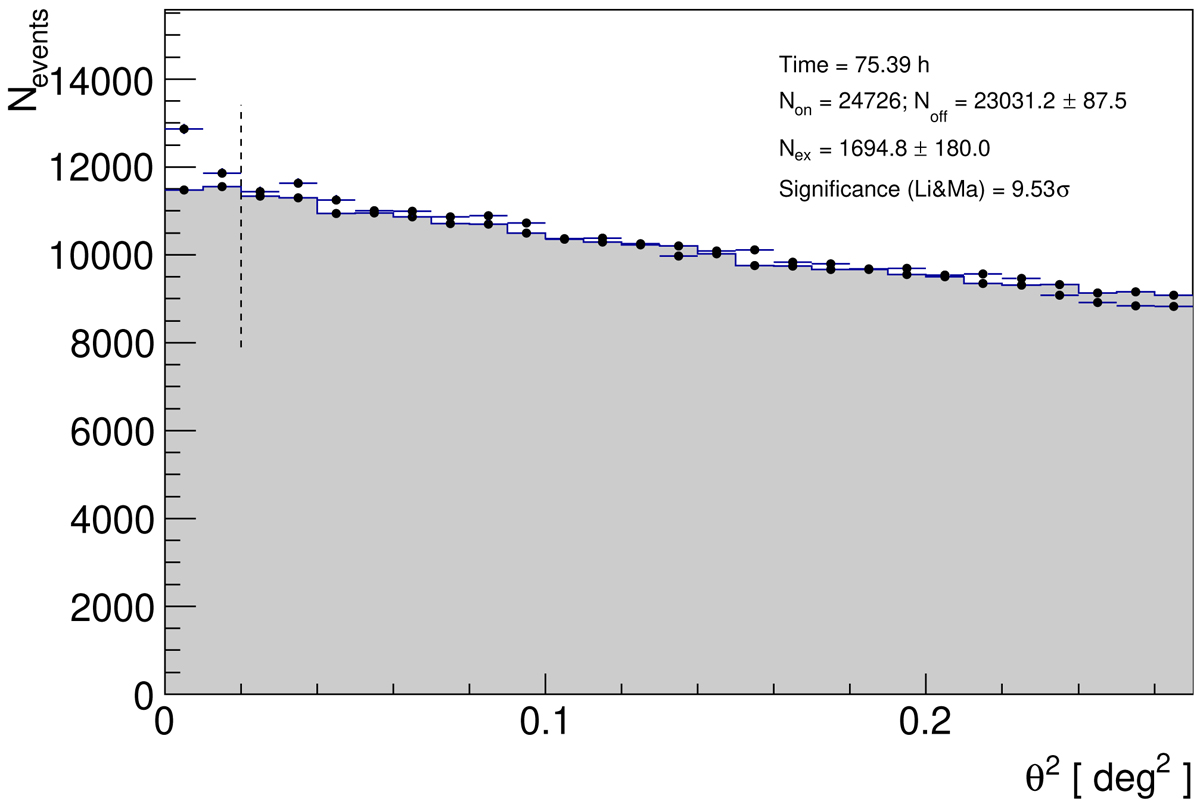
Distribution of θ 2, the squared angular distance between the reconstructed arrival direction of individual events and the nominal source position (points) or background estimation region (gray filled area) for MAGIC observations of PKS 1510–089. The dashed line shows the value of the θ 2 up to which the significance of the detection (see the inset text) is calculated.
Current usage metrics show cumulative count of Article Views (full-text article views including HTML views, PDF and ePub downloads, according to the available data) and Abstracts Views on Vision4Press platform.
Data correspond to usage on the plateform after 2015. The current usage metrics is available 48-96 hours after online publication and is updated daily on week days.
Initial download of the metrics may take a while.