Fig. 1.
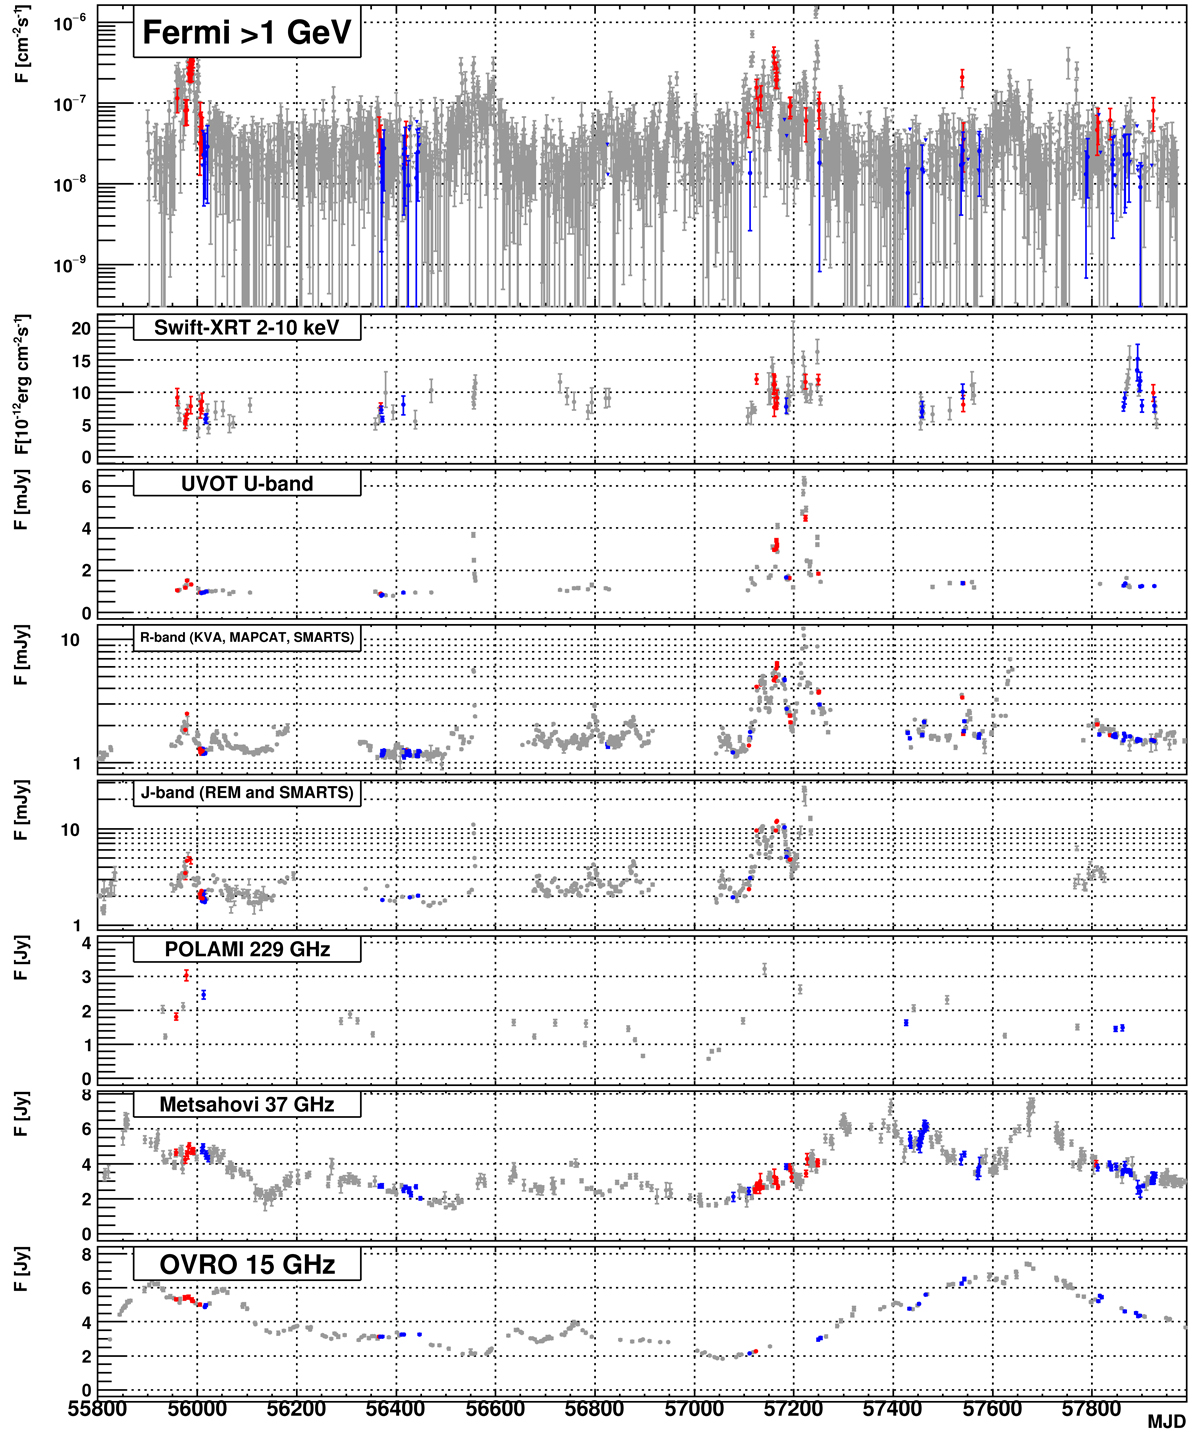
Multiwavelength light curve of PKS 1510–089 between 2012 and 2017. From top to bottom panels: Fermi-LAT flux above 1 GeV; Swift-XRT flux 2–10 keV; U band flux from UVOT; KVA, SMARTS and MAPCAT optical flux in R-band; IR flux from REM and SMARTS in J band; radio 229 GHz flux measured by POLAMI; radio 37 GHz flux measured by Metsähovi; 15 GHz flux measured by OVRO. The red points show the observations within 12 h (or 3 days for the radio measurements) when MAGIC data have been taken during the time that Fermi-LAT flux is above 3 × 10⁻⁸ cm−2 s−1, while the blue points are observations in time bins with Fermi-LAT flux below this flux value (i.e., the low-state sample). IR, optical and UV data have been dereddened using Schlafly & Finkbeiner (2011).
Current usage metrics show cumulative count of Article Views (full-text article views including HTML views, PDF and ePub downloads, according to the available data) and Abstracts Views on Vision4Press platform.
Data correspond to usage on the plateform after 2015. The current usage metrics is available 48-96 hours after online publication and is updated daily on week days.
Initial download of the metrics may take a while.