Fig. 6.
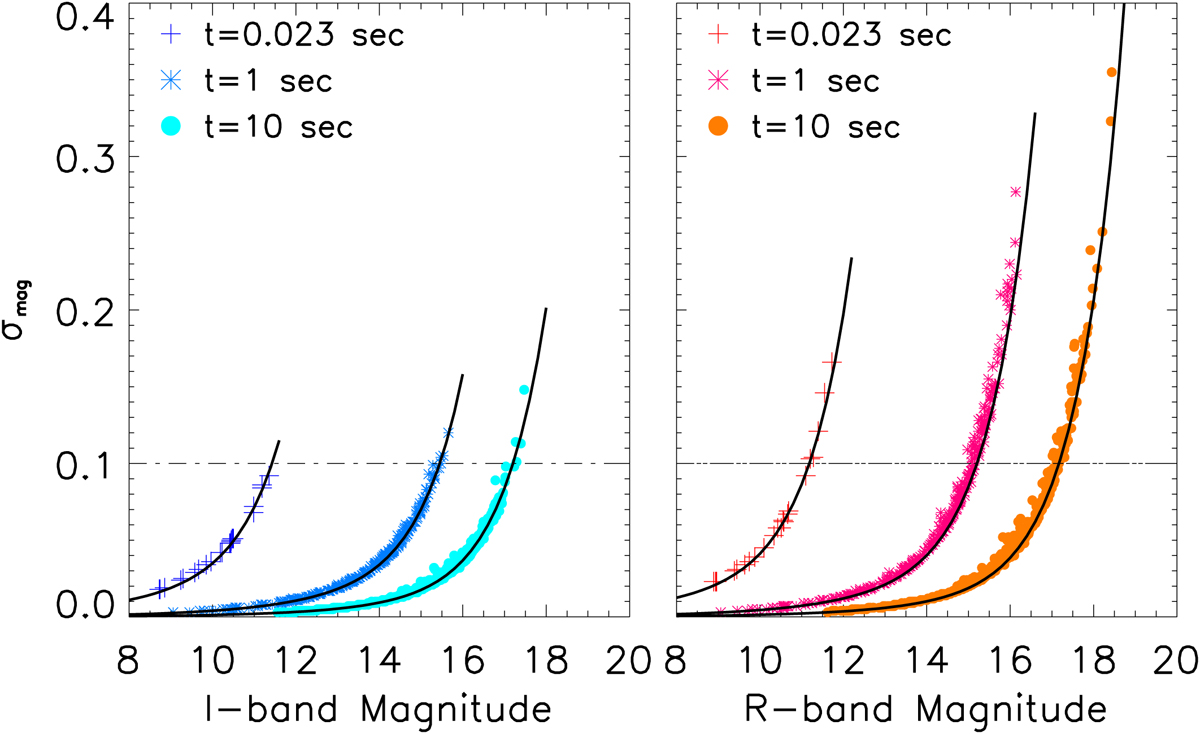
Instrument performance for the two channels (I- and R-band; left and right panels respectively). In each panel the measured magnitudes of stars in the open cluster NGC 1960 are plotted against their measured uncertainty (σmag) for three different exposure settings (10 s (circles), 1 s (asteriscs) and 0.023 s (crosses)). The curves passing through the photometric measurements are the model predictions of Eq. (1) providing information on the magnitude level that can be reached at a certain σmag level (see text for more details). The horizontal line in each panel indicate the 0.1 mag noise level.
Current usage metrics show cumulative count of Article Views (full-text article views including HTML views, PDF and ePub downloads, according to the available data) and Abstracts Views on Vision4Press platform.
Data correspond to usage on the plateform after 2015. The current usage metrics is available 48-96 hours after online publication and is updated daily on week days.
Initial download of the metrics may take a while.