Fig. 3.
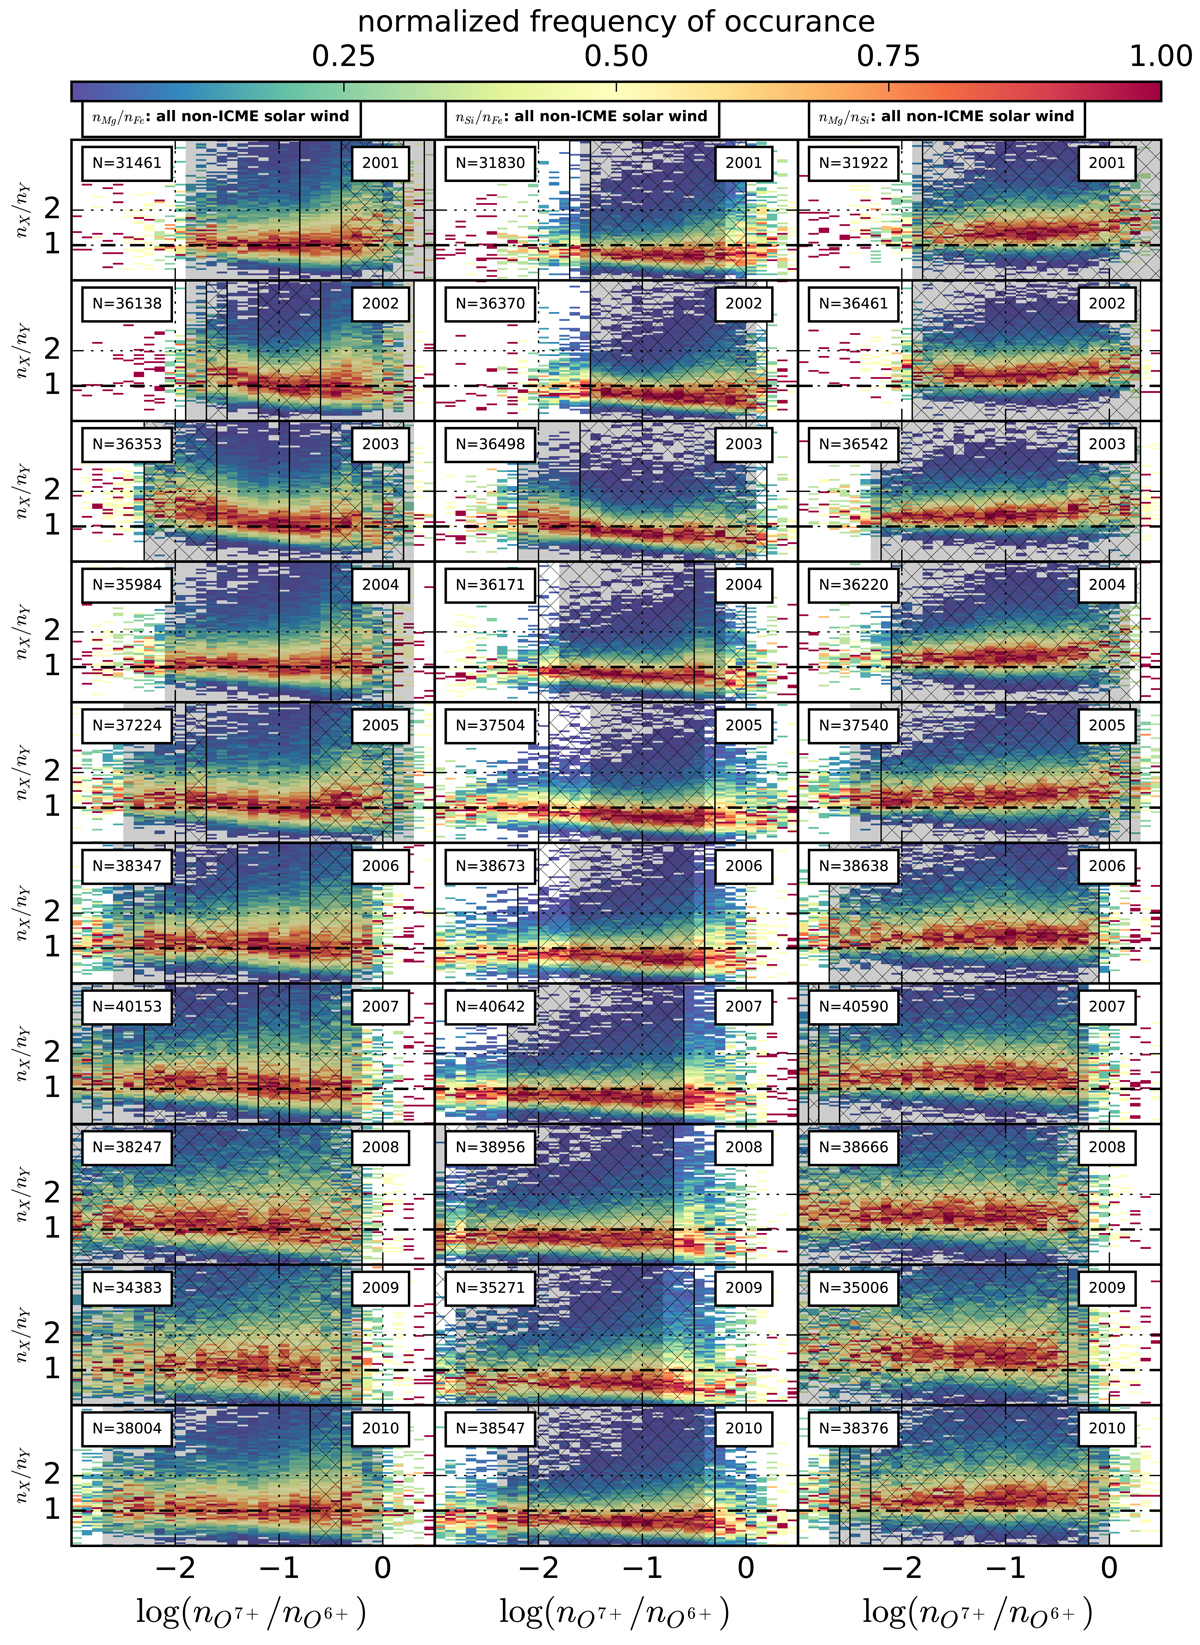
Relative densities for pairs of low FIP elements. The columns correspond to the density ratios Mg/Fe, Si/Fe, and Mg/Si. As in Fig. 1, each panel shows a 2D histogram of 12 min observations for one year normalized for each O charge state ratio bin. The insets again specify the number of data points contained in each panel. Gray shading indicates bins with significantly different mean densities and the cross-hatching marks bins where the standard deviation of the two distributions are significantly different. The dashed horizontal line marks an abundance ratio of one.
Current usage metrics show cumulative count of Article Views (full-text article views including HTML views, PDF and ePub downloads, according to the available data) and Abstracts Views on Vision4Press platform.
Data correspond to usage on the plateform after 2015. The current usage metrics is available 48-96 hours after online publication and is updated daily on week days.
Initial download of the metrics may take a while.