Fig. 2.
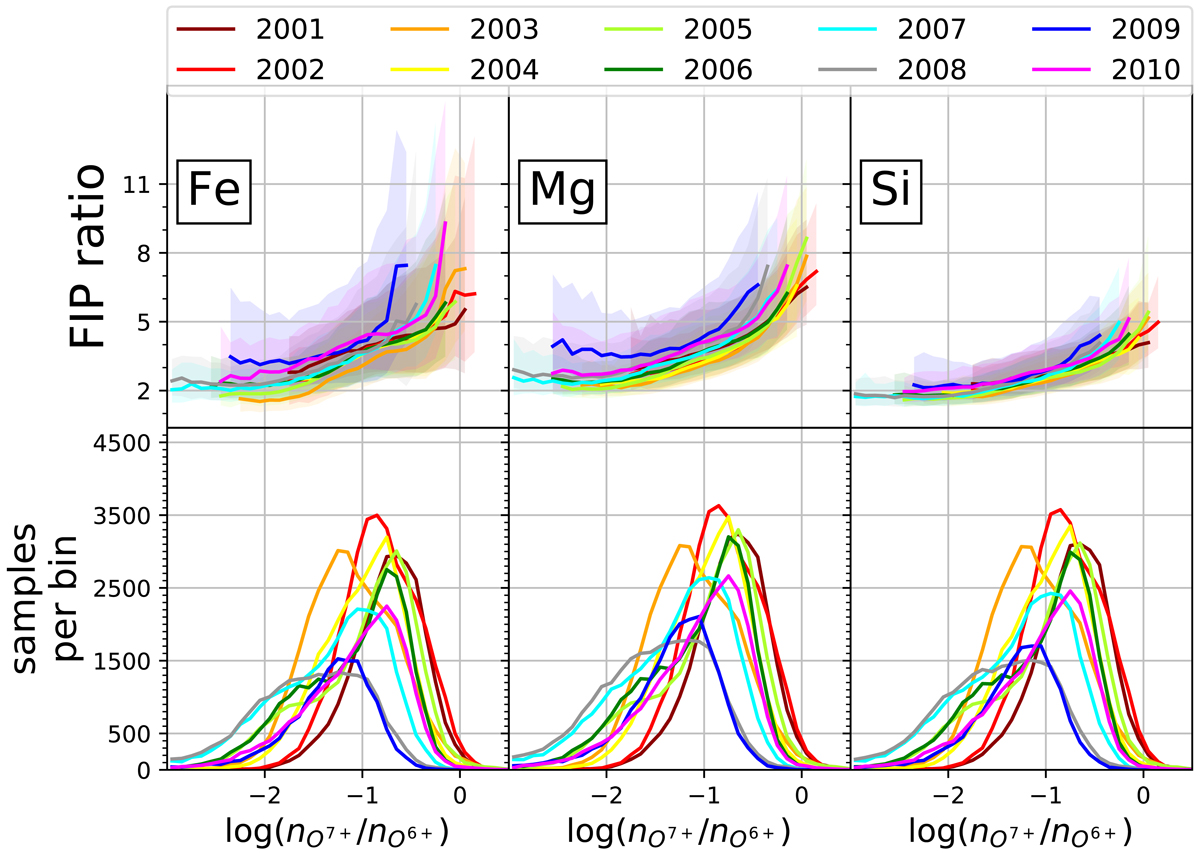
Median FIP ratios per year from 2001 to 2010 for Fe, Mg, and Si. The median is given only if at least 100 samples were observed in the respective bin. The colored shading indicates the 15.9th and 81.1th percentile for each year. In the lower panels the number of samples per O charge state bin and year are shown for Fe, Mg, and Si.
Current usage metrics show cumulative count of Article Views (full-text article views including HTML views, PDF and ePub downloads, according to the available data) and Abstracts Views on Vision4Press platform.
Data correspond to usage on the plateform after 2015. The current usage metrics is available 48-96 hours after online publication and is updated daily on week days.
Initial download of the metrics may take a while.