Fig. 1.
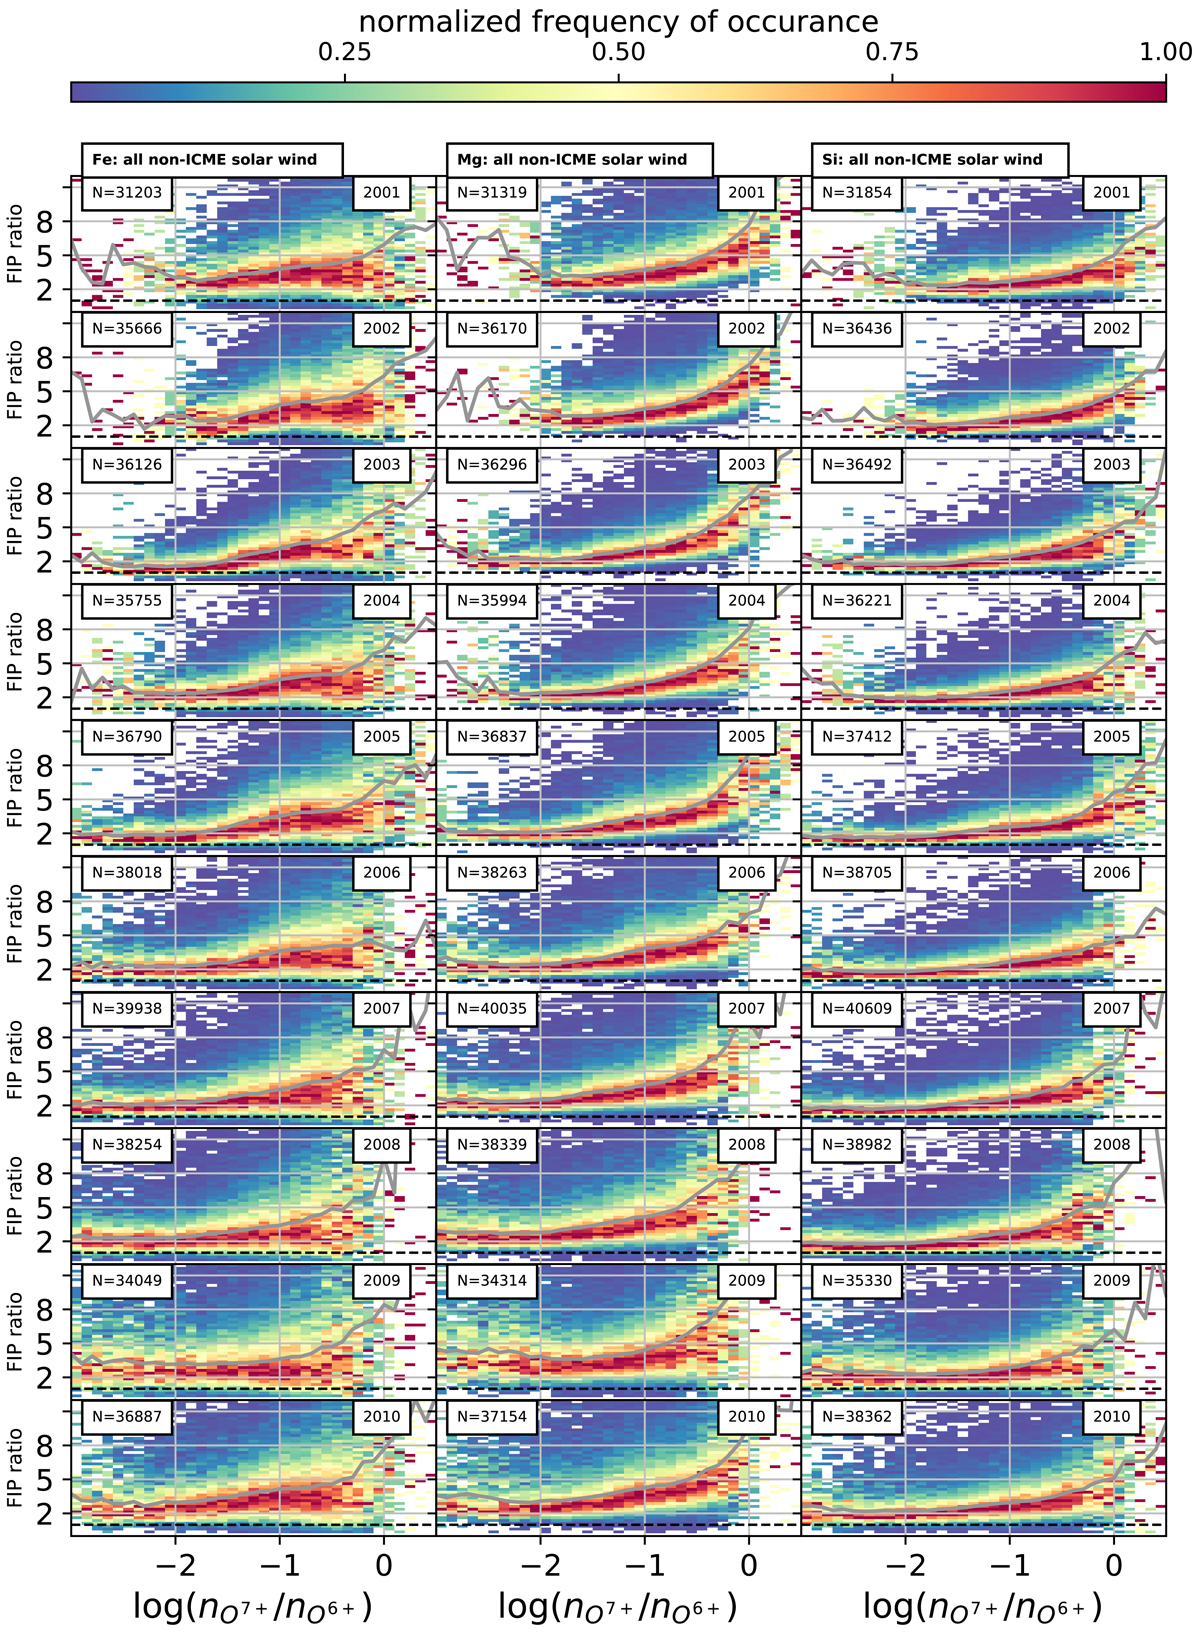
FIP ratios per year from 2001 to 2010. The columns show the FIP ratios for Fe, Mg, and Si. Each row corresponds to the same year. In each panel, a 2D histogram of all 12 min observations of FIP ratios vs the ![]() from the respective year are shown. Each vertical slice is normalized to its maximum. The number of contained data points is given in the inset of each panel. The dashed horizontal line indicates a FIP ratio of one. The gray solid line marks the median of the FIP ratio in each respective O charge state ratio bin.
from the respective year are shown. Each vertical slice is normalized to its maximum. The number of contained data points is given in the inset of each panel. The dashed horizontal line indicates a FIP ratio of one. The gray solid line marks the median of the FIP ratio in each respective O charge state ratio bin.
Current usage metrics show cumulative count of Article Views (full-text article views including HTML views, PDF and ePub downloads, according to the available data) and Abstracts Views on Vision4Press platform.
Data correspond to usage on the plateform after 2015. The current usage metrics is available 48-96 hours after online publication and is updated daily on week days.
Initial download of the metrics may take a while.