Fig. 6.
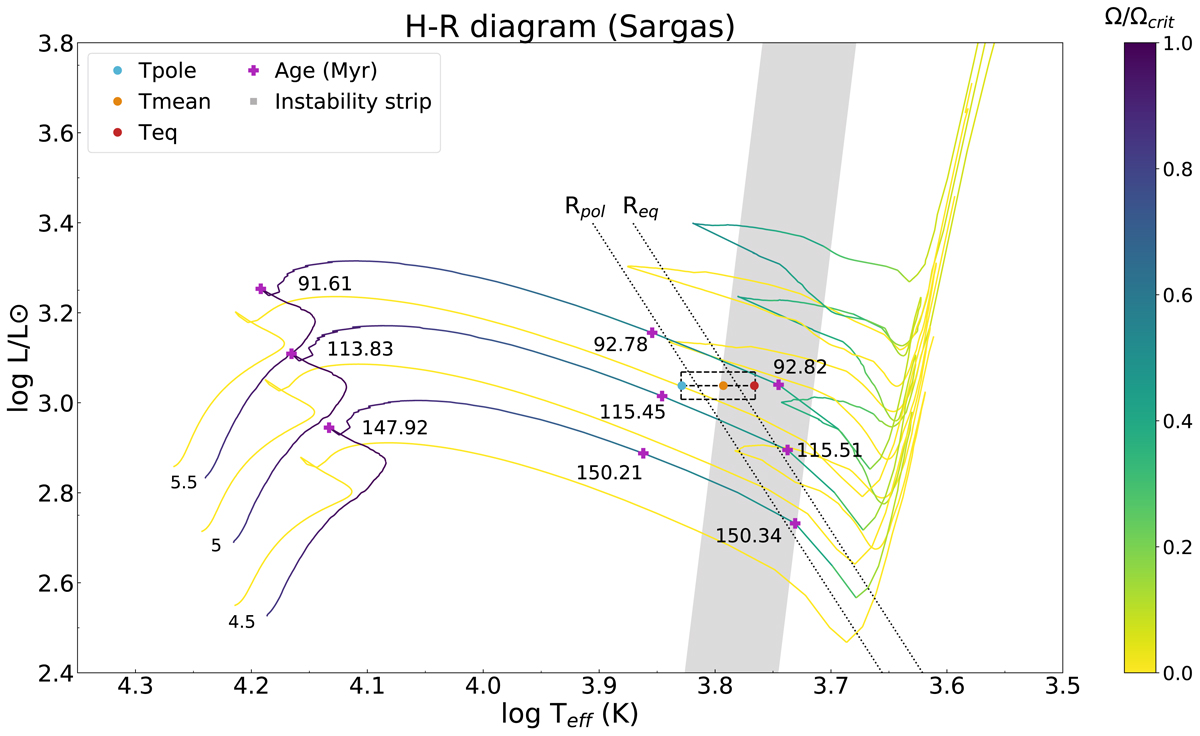
Sargas’ position in the H-R diagram (best-fit from the β- and ω-models) together with selected evolutionary tracks from Georgy et al. (2013) at solar metallicity (Z = 0.014) for comparison. The selected tracks correspond (1) to initial masses enclosing Sargas’ mass, as indicated by the values (in M⊙) at the bottom-left (ZAMS position), and (2) to the two extreme rotation rates in Georgy’s et al. models, i.e., Ω = 0.95Ωc (multi-colored tracks) and Ω = 0 (yellow curves corresponding to evolution without rotation). The position of Sargas is represented by the three colored dots (connected by a dashed line) at the polar (Tp in blue), average (![]() in orange), and equatorial (Teq in red) effective temperatures for the estimated luminosity. It is interesting to note that, because of GD, the polar regions of Sargas are located outside the Cepheid instability strip, while the equatorial regions are located inside it; following Georgy et al. (2013) this instability strip was obtained from (Tammann et al. 2003, Eq. (37)). We also note that, according to these evolutionary tracks for high rotation rates, Sargas is located in the Hertzsprung gap, corresponding to a short-lived phase of hydrogen-shell burning, just after the end of the main sequence (indicated by crosses and corresponding ages in the left). These high-rotation-rate tracks do not present a blue loop phase compatible with Sargas’ position in the H-R diagram. Moreover, the very fast time evolution (∼0.1 Myr) indicated by the ages enclosing (crosses) Sargas’ position and the large radius measured by us suggest that this star is quickly approaching the end of the shell-burning phase, just after reaching the Schönberg–Chandrasekhar limit (Schönberg & Chandrasekhar 1942). The two dotted straight lines are simply references showing the
in orange), and equatorial (Teq in red) effective temperatures for the estimated luminosity. It is interesting to note that, because of GD, the polar regions of Sargas are located outside the Cepheid instability strip, while the equatorial regions are located inside it; following Georgy et al. (2013) this instability strip was obtained from (Tammann et al. 2003, Eq. (37)). We also note that, according to these evolutionary tracks for high rotation rates, Sargas is located in the Hertzsprung gap, corresponding to a short-lived phase of hydrogen-shell burning, just after the end of the main sequence (indicated by crosses and corresponding ages in the left). These high-rotation-rate tracks do not present a blue loop phase compatible with Sargas’ position in the H-R diagram. Moreover, the very fast time evolution (∼0.1 Myr) indicated by the ages enclosing (crosses) Sargas’ position and the large radius measured by us suggest that this star is quickly approaching the end of the shell-burning phase, just after reaching the Schönberg–Chandrasekhar limit (Schönberg & Chandrasekhar 1942). The two dotted straight lines are simply references showing the ![]() relation for spherical hypothetical stars with radii Rp and Req. This same relation was also used to estimate the uncertainty region for Sargas’ position in the H-R diagram (dashed rectangle), where the uncertainties on L, Tp, and Teq were estimated from the measured uncertainties on Req and
relation for spherical hypothetical stars with radii Rp and Req. This same relation was also used to estimate the uncertainty region for Sargas’ position in the H-R diagram (dashed rectangle), where the uncertainties on L, Tp, and Teq were estimated from the measured uncertainties on Req and ![]() (cf. Table 2).
(cf. Table 2).
Current usage metrics show cumulative count of Article Views (full-text article views including HTML views, PDF and ePub downloads, according to the available data) and Abstracts Views on Vision4Press platform.
Data correspond to usage on the plateform after 2015. The current usage metrics is available 48-96 hours after online publication and is updated daily on week days.
Initial download of the metrics may take a while.