Fig. 4.
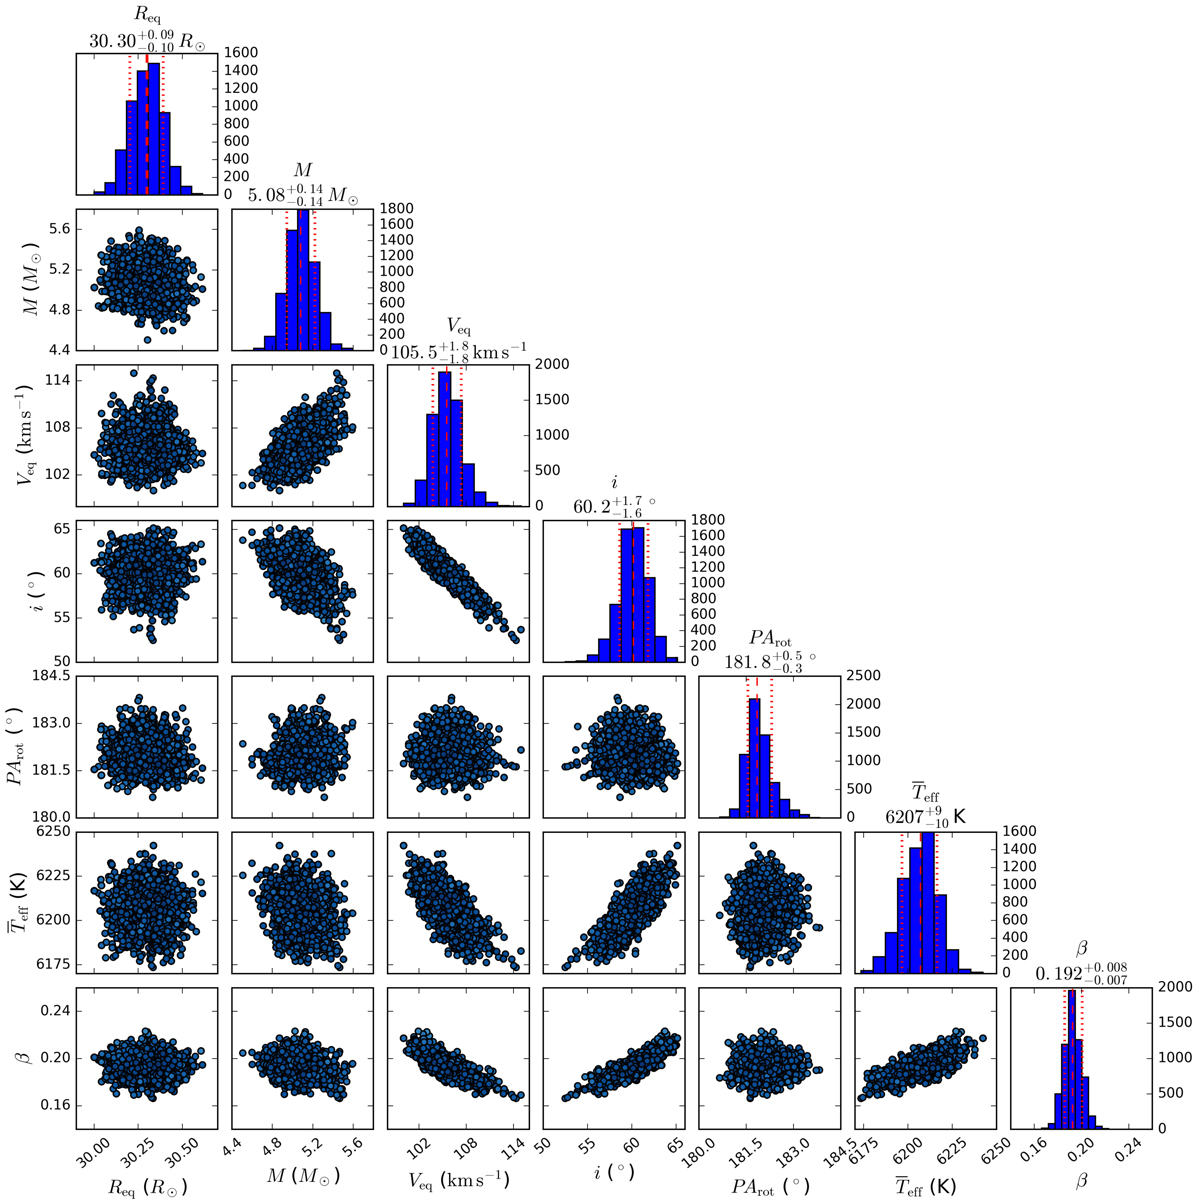
Results obtained from the fit of the β-model to the interferometric and spectroscopic observations Sargas using the CHARRON and emcee codes (further details in the text). The figure shows one- (histograms) and two-dimensional projections of the posterior probability distributions obtained from the fitted parameters. The median (dashed lines) and uncertainties (dotted lines) obtained from the histograms for each fitted parameter are also indicated over the plots and correspond to the values given in Table 2. In the two-dimensional plots lower (higher) χ2 values correspond to darker (lighter) symbols; these 6000 points correspond to the converged final results of the MCMC model-fitting with emcee.
Current usage metrics show cumulative count of Article Views (full-text article views including HTML views, PDF and ePub downloads, according to the available data) and Abstracts Views on Vision4Press platform.
Data correspond to usage on the plateform after 2015. The current usage metrics is available 48-96 hours after online publication and is updated daily on week days.
Initial download of the metrics may take a while.