Fig. 3.
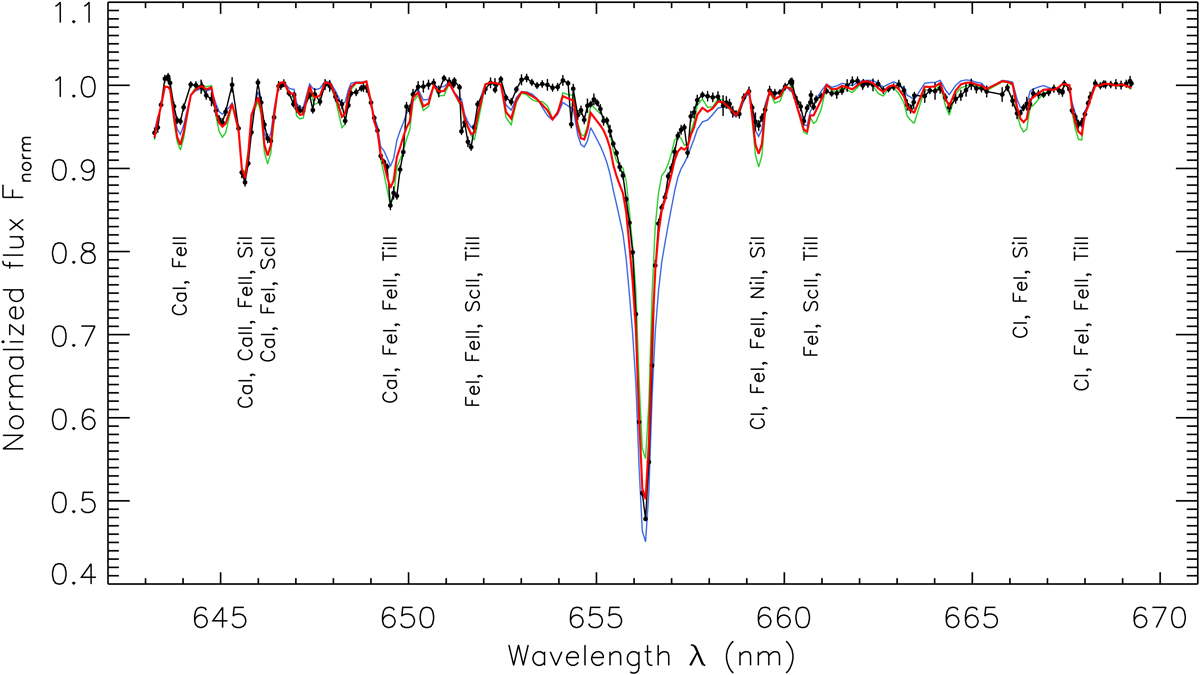
Comparison between the normalized flux from UVES (black dots with error bars) and from the β-best-fit model (red curve) presented in Table 2. The spectra shown span ∼26 nm centered on the Hα line, where the main atoms and ions contributing to the strongest absorption lines have been identified. These observations correspond to 257 selected wavelengths, which homogeneously sample the whole relevant spectral range, as shown by the data points. The thin curves correspond to normalized model fluxes for the same β-best-fit model, but where we have fixed Teff to Tp (blue) and Teq (green) over the whole photosphere (model without GD, i.e., β = 0). Clearly the complete best-fit model, with GD, better reproduces the observed spectral lines compared to the simpler model spectra computed with β = 0.
Current usage metrics show cumulative count of Article Views (full-text article views including HTML views, PDF and ePub downloads, according to the available data) and Abstracts Views on Vision4Press platform.
Data correspond to usage on the plateform after 2015. The current usage metrics is available 48-96 hours after online publication and is updated daily on week days.
Initial download of the metrics may take a while.