Fig. 2.
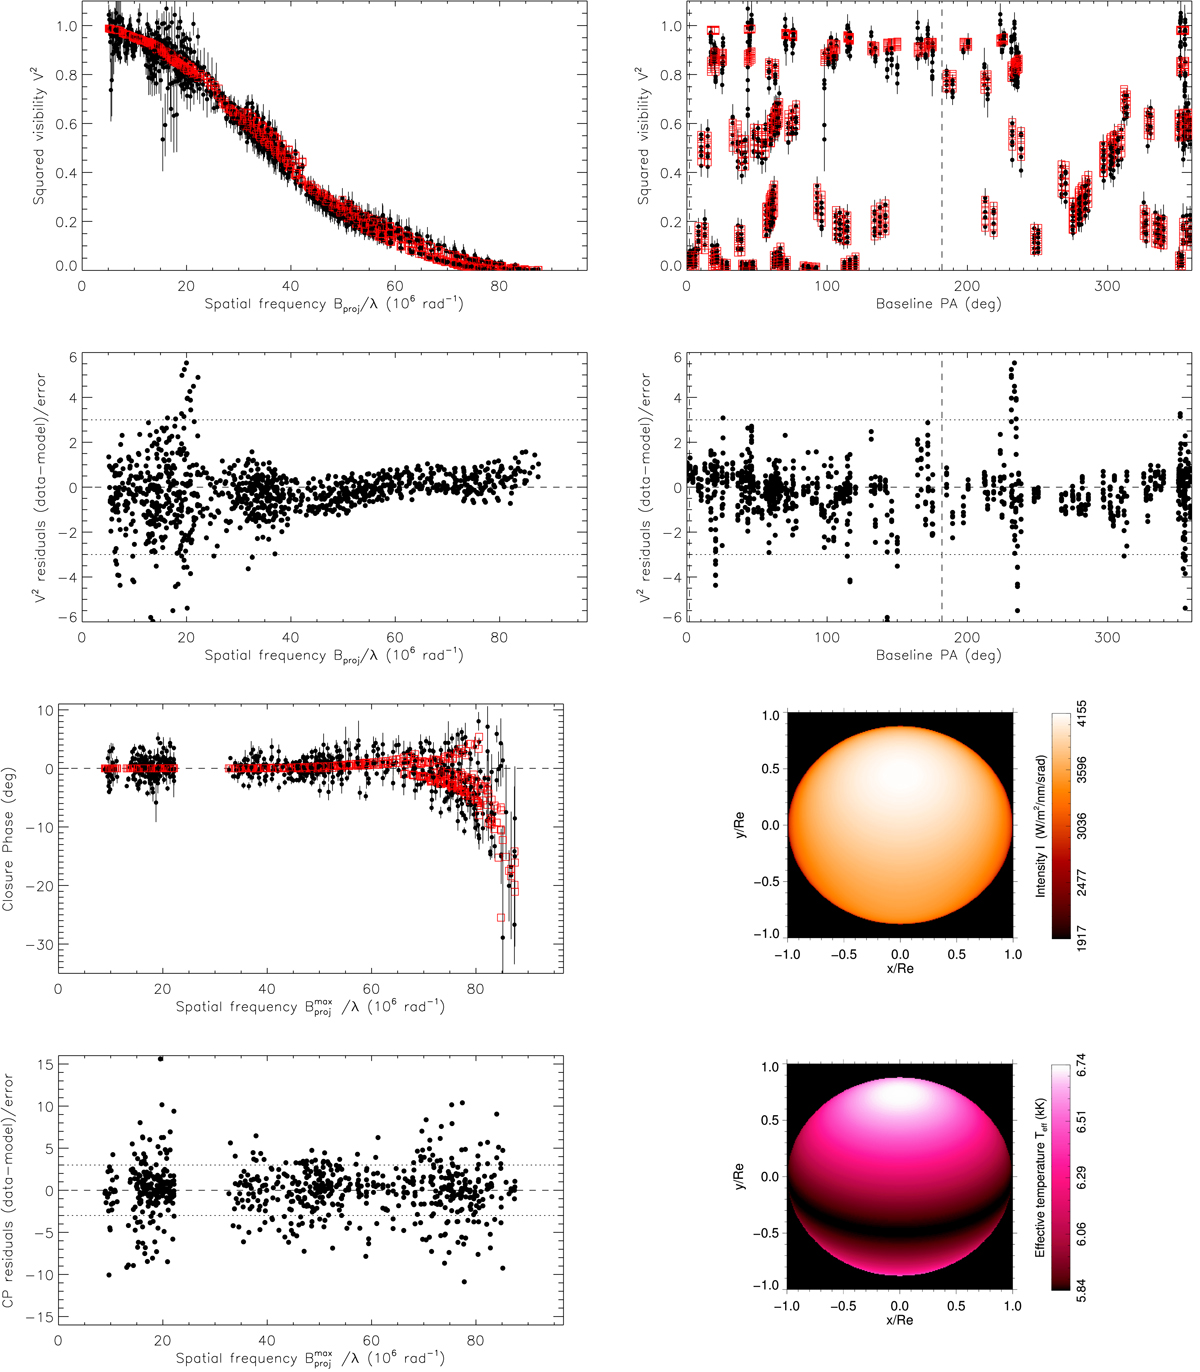
Comparison between interferometric observables from PIONIER (black dots with error bars) and from the β-best-fit model (red squares) presented in Table 2: squared visibilities V2 as a function of both spatial frequencies and baseline position angles (PA), and closure phases as a function of spatial frequencies defined at the longest baseline of the corresponding triangle. The error-normalized residuals of these comparisons are also shown (black dots); horizontal lines indicate the 0 (dashed line) and ±3σ (dotted line) reference values. The vertical dashed lines in the plots with PA abscissas indicate the PAs of the sky-projected rotation axis for the visible (PArot) and hidden (PArot − 180°) stellar poles. The two images at the bottom right show one specific intensity map, computed at the 1.62 μm spectral channel of the PIONIER data, and the Teff map corresponding to this β-best-fit model. These images are not rotated by PArot, i.e., they do not represent the star in sky coordinates.
Current usage metrics show cumulative count of Article Views (full-text article views including HTML views, PDF and ePub downloads, according to the available data) and Abstracts Views on Vision4Press platform.
Data correspond to usage on the plateform after 2015. The current usage metrics is available 48-96 hours after online publication and is updated daily on week days.
Initial download of the metrics may take a while.