Fig. 1.
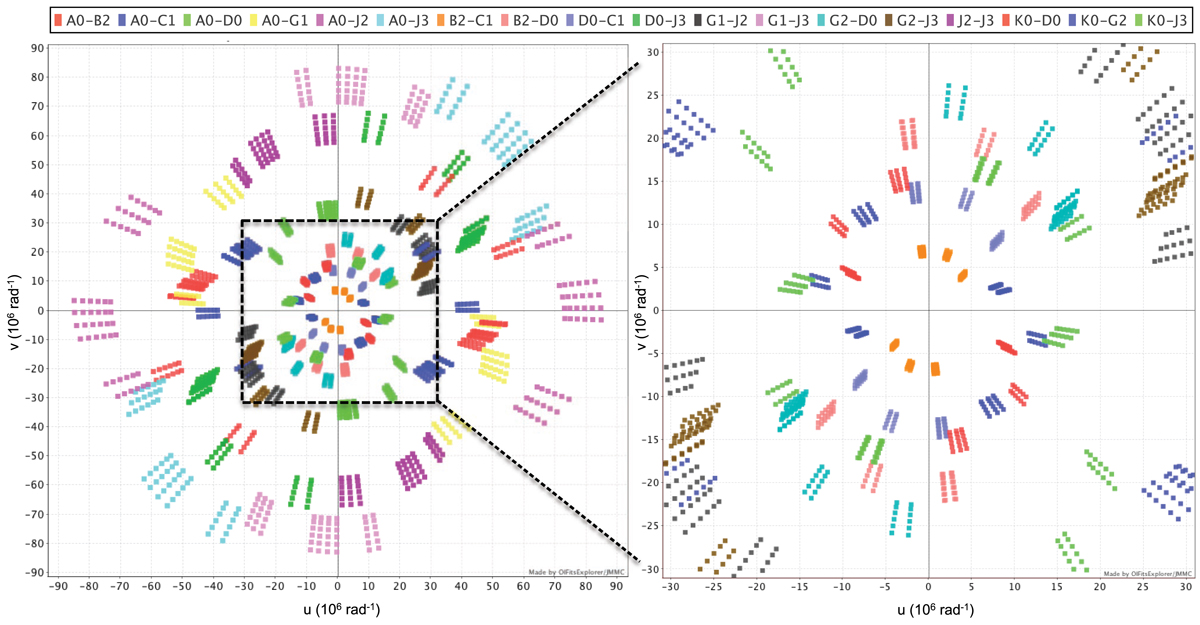
uv coverage (units of spatial frequency) of VLTI/PIONIER observations of Sargas. The VLTI baselines used are identified with different colors (the corresponding AT stations are indicated in the upper legend). The six points per baseline correspond to the six spectral channels of the PIONIER H band observations as described in Sect. 2.1. Projected baselines Bproj range from ∼9 to ∼132 m. A zoom of the central region is shown in the right panel, corresponding to a maximum Bproj of ∼50 m. Image adapted from the OIFits Explorer service from JMMC.
Current usage metrics show cumulative count of Article Views (full-text article views including HTML views, PDF and ePub downloads, according to the available data) and Abstracts Views on Vision4Press platform.
Data correspond to usage on the plateform after 2015. The current usage metrics is available 48-96 hours after online publication and is updated daily on week days.
Initial download of the metrics may take a while.