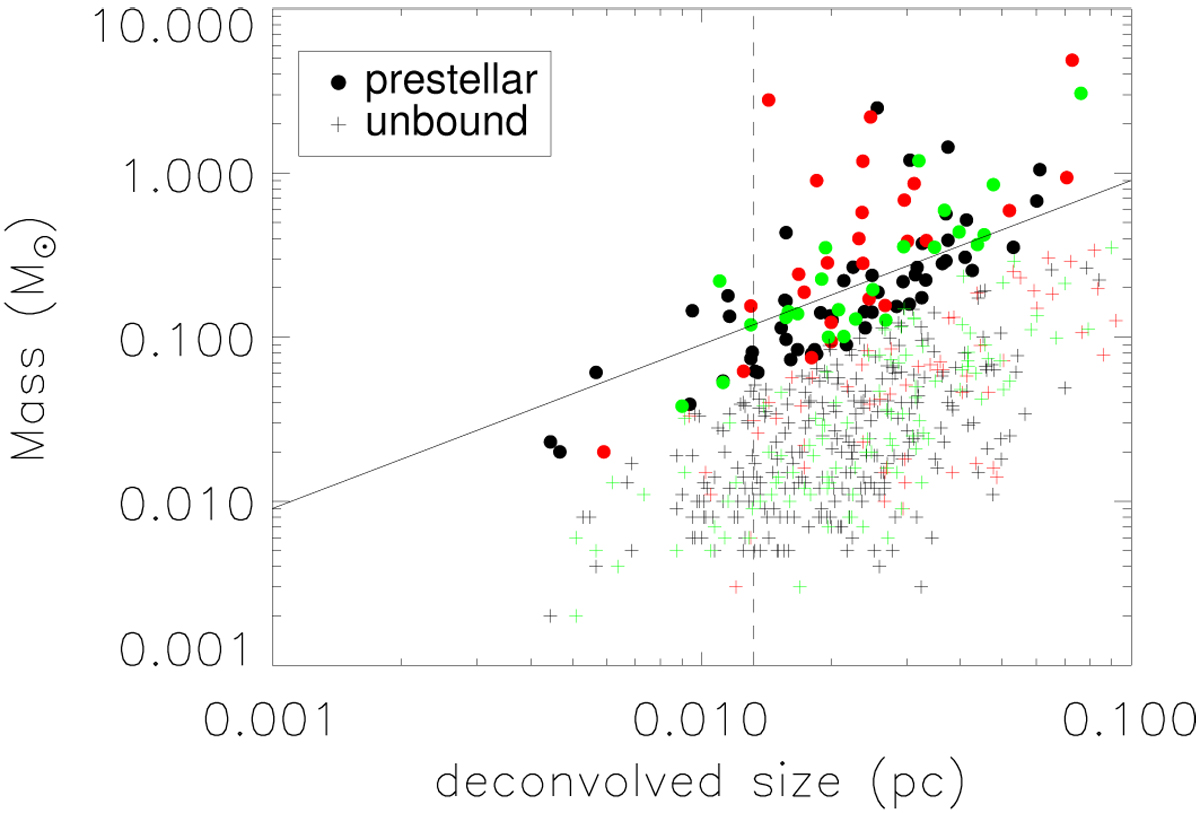
Fig. 4

Mass versus size diagram for the entire population of starless cores. The core sizes were estimated from the geometrical average between the major and minor FWHM measured by getsources in the high-resolution column density map and deconvolved from the 18.′′ 2 HPBW resolution of the map. The 18.′′2 resolution at the distance of 150 pc is indicated by the dashed line. Candidate prestellar cores are plotted with circular symbols and unbound cores with crosses. Colours indicate cores from the three regions: Lupus I (black), Lupus III (red), Lupus IV (green). The solid line indicates the virial criterion (MBE,crit∕Mobs = 2), assuming T = 11 K and d = 150 pc; cores above this line are considered robust candidate prestellar cores.
Current usage metrics show cumulative count of Article Views (full-text article views including HTML views, PDF and ePub downloads, according to the available data) and Abstracts Views on Vision4Press platform.
Data correspond to usage on the plateform after 2015. The current usage metrics is available 48-96 hours after online publication and is updated daily on week days.
Initial download of the metrics may take a while.


