Fig. 11
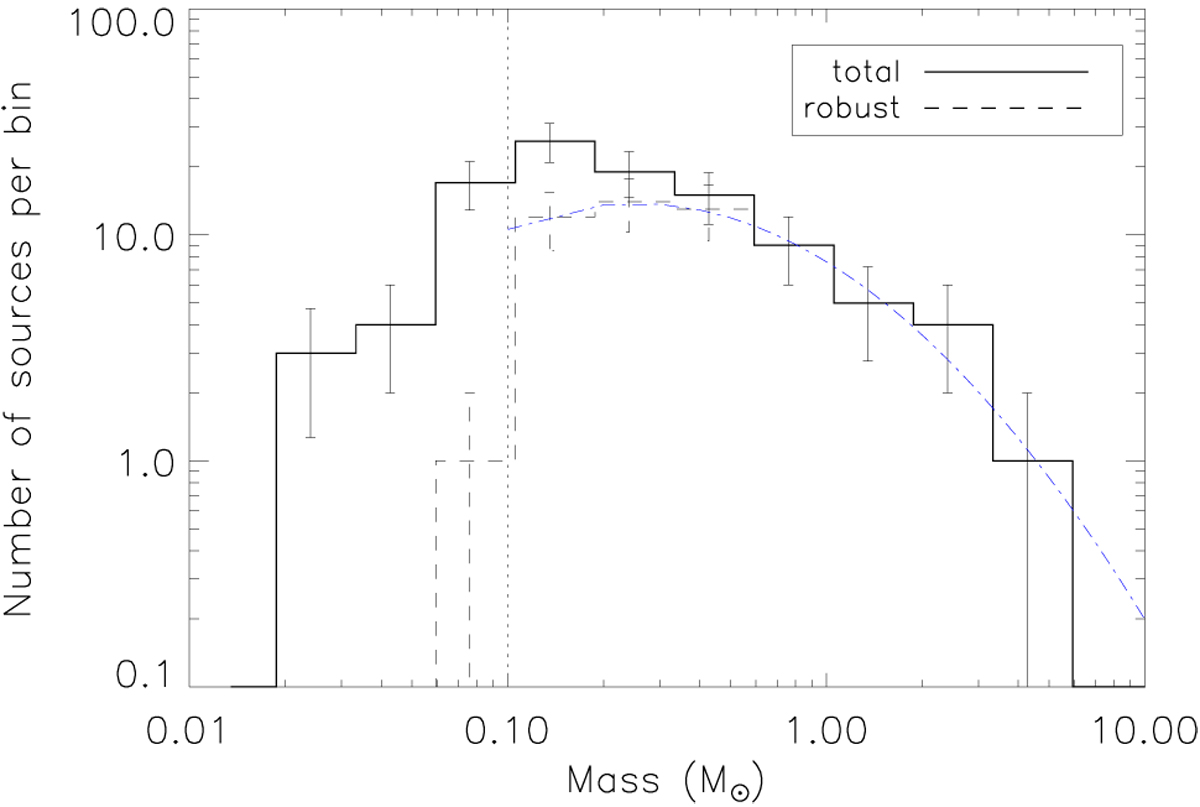
Core mass function of the total sample of prestellar cores detected in the three Lupus clouds (solid line) and that ofthe robust sub-sample (dashed line). The dashed-dotted line is the log-normal fit, with central mass of (0.25 ± 0.04) M⊙ and a standard deviation of 0.55 ± 0.04. The verticalline indicates the completeness limit of the prestellar cores sample.
Current usage metrics show cumulative count of Article Views (full-text article views including HTML views, PDF and ePub downloads, according to the available data) and Abstracts Views on Vision4Press platform.
Data correspond to usage on the plateform after 2015. The current usage metrics is available 48-96 hours after online publication and is updated daily on week days.
Initial download of the metrics may take a while.